
Fig. 11.
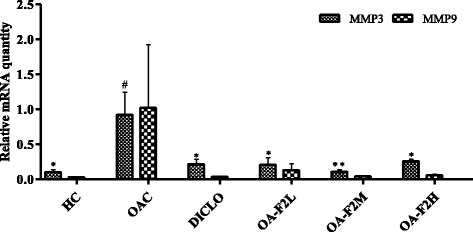
Effect of OA-F2 on the mRNA expression of MMP3 and MMP9 in the synovium of rats. Values are expressed as Mean ± SE (n = 3). Comparisons were done between OAC/HC and each individual treated group by Dunnett’s multiple comparison test. * p < 0.05; ** p < 0.01 Compared to OAC. # p < 0.05 compared to HC. HC: Healthy control, OAC: Osteoarthritic control, DICLO: Positive control, OA-F2L: OA-F2 at 135 mg/kg b. wt., OA-F2M: OA-F2 at 270 mg/kg b. wt., OA-F2H: OA-F2 at 540 mg/kg b. wt