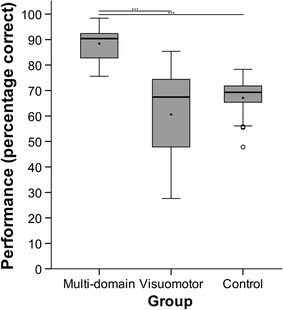
Fig. 1.

Percentage of performance in the multi-domain task (wine tasting) during EEG acquisition for the multi-domain group, the visuomotor group, and the control group. Boxplots show median (black line), mean (black dot in the interquartile range), lower and upper quartile (box), values between 1.5 and 3 times the interquartile range (circles; 3 participants). ***p < .001
