Fig. 2.

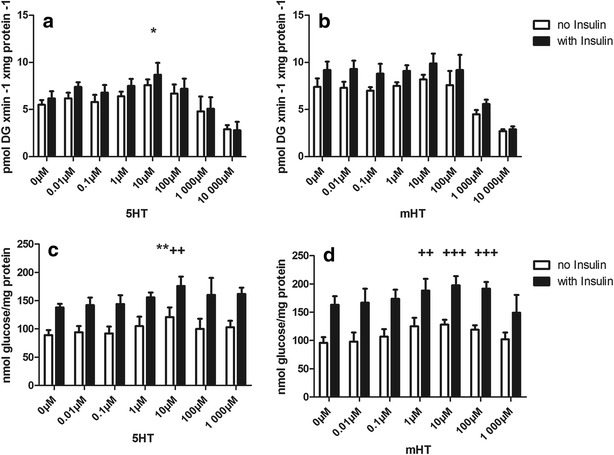
a, b Analysis of glucose uptake with increasing concentrations of 5-HT (a) or mHT (b). L6 cells were incubated with increasing concentrations of either 5-HT or mHT in the presence (solid bar) or absence (empty bar) of 100 nM insulin for 1 h. Significant differences are indicated as *P < 0.05 for comparison to the condition at 0 nM of 5-HT in the absence of insulin. (N ≥ 3 in triplicate). c, d Analysis of glycogen content with increasing concentrations of 5-HT ( c ) or mHT (d). L6 cells were incubated with increasing concentrations of either 5-HT or mHT in the presence (solid bar) or absence (empty bar) of 100 nM insulin for 3 h. Significant differences are indicated as **P < 0.01 for comparison to the condition at 0 nM of 5-HT in the absence of insulin and ++P < 0.01 or +++P < 0.001 for comparison to the condition at 0 nM of 5-HT or mHT in the presence of insulin (N ≥ 3 in triplicate)
