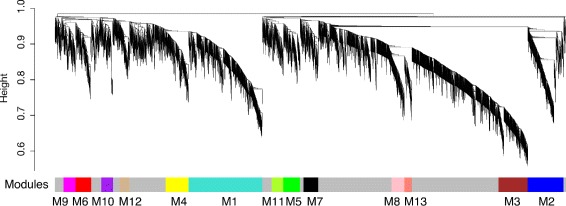
Fig. 1.

Weighted gene co-expression network analysis of the human placenta reveals distinct clusters of co-expressed genes. Weighted gene co-expression network analysis of the human placenta reveals distinct clusters of co-expressed genes. Average linkage hierarchical clustering dendrogram of genes based on gene expression topological overlap. Modules of co-expressed genes were assigned colours and identifiers M1–M13, which are represented in the horizontal bar below the dendrogram
