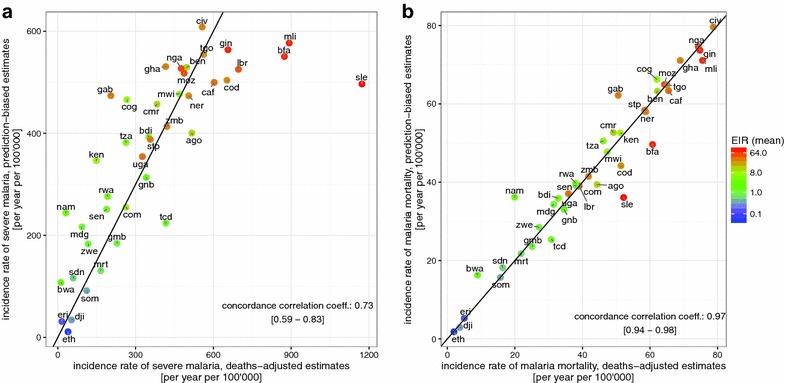
Fig. 3.

Predicted national levels of severe incidence and malaria mortality rates. a Severe incidence (per year per 100,000) and (b) malaria mortality (per year per 100,000). In both panels, the horizontal axis indicates predicted national levels assuming the deaths-adjusted estimate of the proportion of severe cases treated as in-patients. The vertical axis indicates predicted national levels when assuming the prediction-biased estimate of the proportion of severe cases treated as in-patients. Mean EIR for each country is indicated by colour, with red high and blue low. The concordance correlation co-efficient was estimated as 0.73 with a confidence interval of [0.59–0.83] in a, and 0.97 with a confidence interval of [0.94–0.98] in b, indicating close agreement between the two estimates. Each country is indicated via their country code (Table 2) and the black line represents the line of equality between the two estimates
