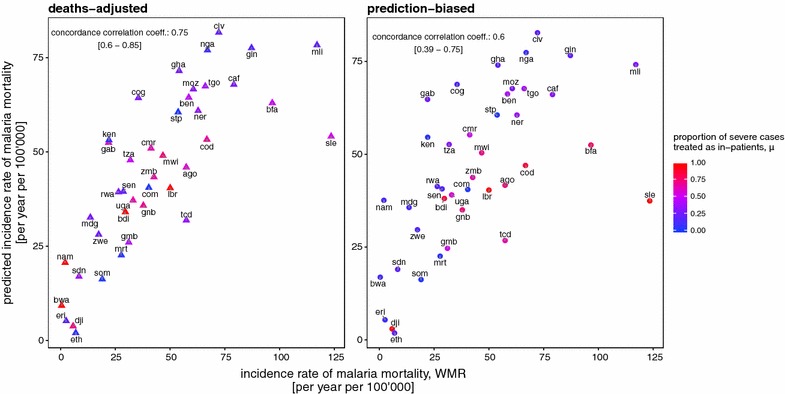
Fig. 4.

Predicted national levels of mortality rates compared with WMR estimates. In both panels, the horizontal axis indicates the WMR estimates of national mortality rates (per year per 100,000). The vertical axis indicates predicted national levels of malaria mortality when assuming; a the prediction-biased proportion of severe cases treated as in-patients, b the deaths-adjusted proportion of severe cases treated as in-patients. Mean estimates of proportion of severe cases receiving in-patient care is indicated by colour, with red high and blue low. The concordance correlation co-efficient was estimated as 0.74 with a confidence interval of [0.59–0.84] in a and 0.6 with a confidence interval of [0.38–0.75] in b. Each country is indicated via their country code (Table 2)
