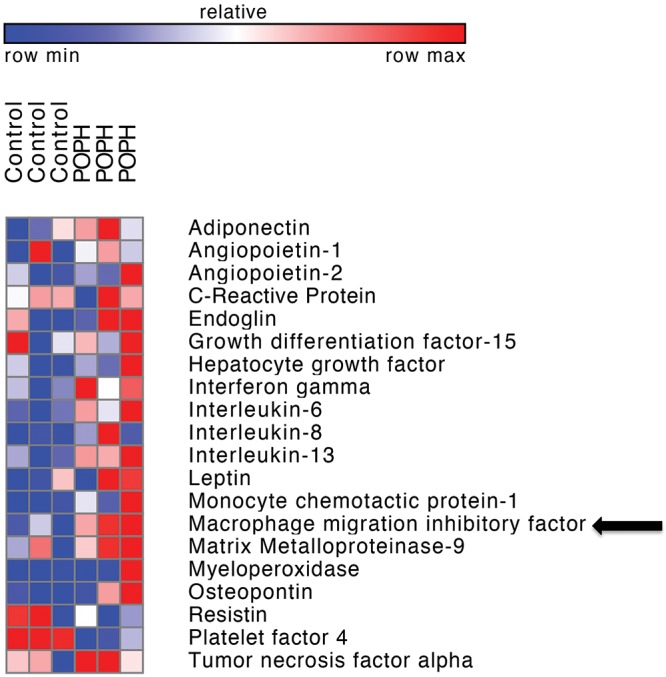
Figure 2.

Antibody microarray. Heat map demonstrating relative expression of a subset of biomarkers from screening antibody microarray (Human XL Cytokine Array, R&D Systems) in patients with portopulmonary hypertension (POPH; n = 3) versus controls (n = 3). Macrophage migration inhibitory factor expression, indicated by an arrow, was 1.6-fold higher in patients with POPH.
