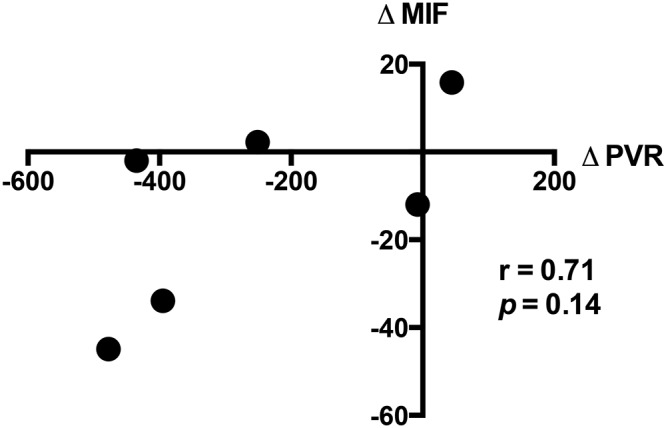
Figure 7.

Treatment response, showing the correlation between absolute change in macrophage migration inhibitory factor (∆MIF; ng/mL) and absolute change in pulmonary vascular resistance (∆PVR; dynes˙s˙cm−5) in 6 patients who underwent cardiac catheterization with sample collection before and after initiation of pulmonary arterial hypertension therapy.
