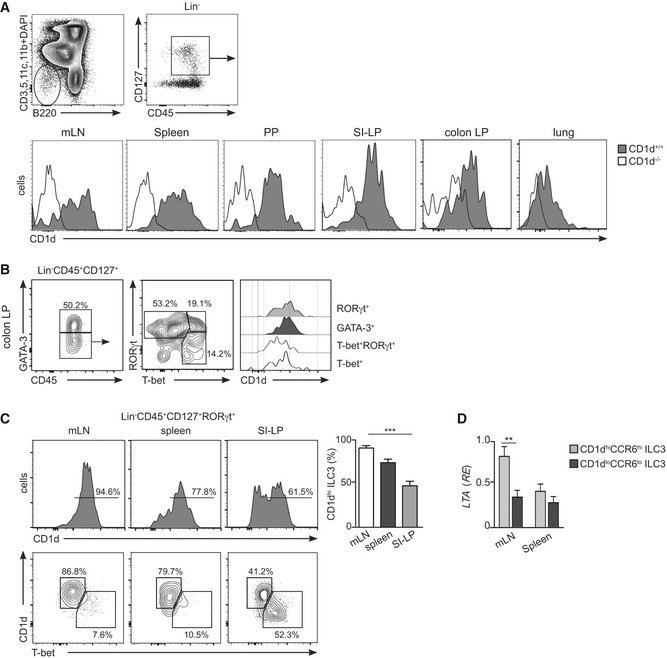
Figure EV1. CD1d expression on ILCs.

- Flow cytometry profiles showing gating strategy and CD1d expression (histogram) in Lin−CD45+CD127+ cells in the depicted tissues from WT (grey filled, n = 4) and CD1d‐deficient (empty profile, n = 4) mice.
- Flow cytometry profiles showing gating strategy and CD1d expression (histograms) in T‐bet+ (empty profile), T‐bet+RORγt+ (dotted line), GATA‐3+ (dark grey) and RORγt+ (light grey) ILCs in colonic lamina propria (n = 3). Numbers indicate percentage of cells in the depicted gates.
- Flow cytometry profiles showing expression of CD1d and T‐bet in Lin−CD45+CD127+RORγt+ cells from mLN, spleen and SI‐LP as indicated (n = 4); numbers indicate percentage of cells. Right panel, percentage of CD1dhi ILC3s in the depicted tissues. ***P < 0.001 two‐tailed unpaired t‐test.
- Relative expression (RE) of lymphotoxin‐alpha (LTA) mRNA (qPCR, normalized to GAPDH) in sort‐purified CD1dhiCCR6hi (light grey) and CD1dlowCCR6low (dark grey) ILC3s isolated from mLN or spleen; **P < 0.01, two‐tailed unpaired t‐test.
