-
A, B
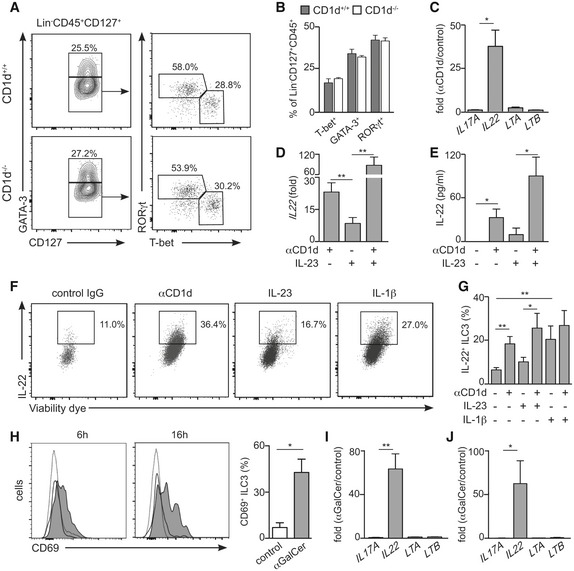
Flow cytometry plots showing gating strategy (A) and percentage of ILC populations (from Lin−CD45+CD127+ cells, B) in mLN from WT (n = 4) and CD1d‐deficient (n = 3) mice.
-
C
Fold change in mRNA expression for the indicated cytokines in ILC3s after antibody‐mediated CD1d cross‐link (n = 3). Gene expression was measured by qPCR and normalized to GAPDH and to the mRNA expression levels in control ILC3s. *P < 0.05 two‐tailed unpaired t‐test.
-
D
Fold change in IL22 mRNA expression in ILC3s after antibody‐mediated CD1d cross‐link and/or IL‐23 stimulation (n = 4). Gene expression was measured by qPCR and normalized to GAPDH and to the mRNA expression levels in control ILC3s. **P < 0.01 two‐tailed unpaired t‐test.
-
E
IL‐22 detection by ELISA in the supernatant of ILC3s cultured in the presence of αCD1d and/or IL‐23 (n = 3). *P < 0.05 two‐tailed unpaired t‐test.
-
F, G
Intracellular cytokine staining (F) and percentage of IL‐22+ ILC3s (G) after stimulation with αCD1d, IL‐23 and/or IL‐1β. *P < 0.05, **P < 0.01 two‐tailed unpaired t‐test (n = 4–8)
-
H
WT mice were i.v. injected with αGalCer or PBS (control) and activation of splenic ILC3s was assessed by flow cytometry as CD69 up‐regulation at 6 or 16 h after injection. Grey filled profile, ILC3 from αGalCer‐injected mice; empty profile, ILC3 from PBS‐injected mice; dotted line, CD45− cells. Right graph, percentage of CD69+ ILC3s 6 h after injection of αGalCer (grey) or PBS (white) (n = 3). *P < 0.05 two‐tailed unpaired t‐test.
-
I, J
Fold change in mRNA expression for the indicated cytokines in ILC3s sort‐purified from spleen (I) or SI‐LP (J) 6 h after intravenous (I) or oral (J) αGalCer administration. Gene expression was measured by qPCR and normalized to GAPDH and to the expression levels in ILC3s sort‐purified from PBS‐injected mice (n = 3). *P < 0.05, **P < 0.01 two‐tailed unpaired t‐test.
Data information: Graphs represent mean ± SEM.

