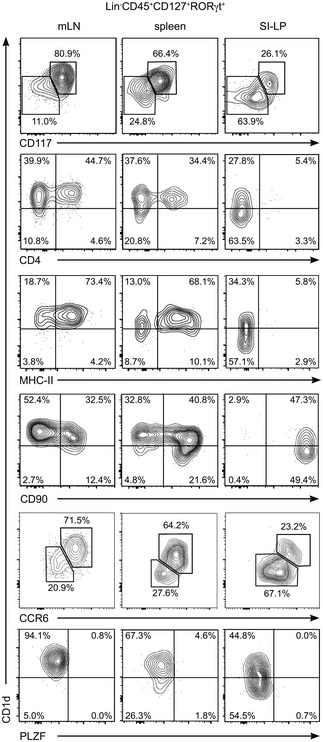
Figure EV3. Phenotype of RORγt+ ILCs.

Flow cytometry profiles showing expression of the depicted markers in RORγt+Lin−CD45+CD127+ ILC3s from mLN, spleen and SI‐LP as indicated. Numbers indicate percentage of cells in the depicted gates. Data represent 2–5 independent experiments.
