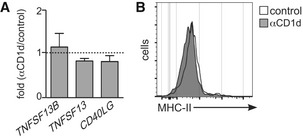
Figure EV5. Effect of CD1d cross‐link on ILC3s.

- Fold change in mRNA expression for the indicated cytokines in ILC3s after antibody‐mediated CD1d cross‐link (n = 4). Gene expression was measured by qPCR and normalized to GAPDH and to the mRNA expression levels in control ILC3s. Graphs represent mean ± SEM.
- Flow cytometry profiles showing MHC‐II expression on ILC3s in after cross‐link with αCD1d antibody (grey) or control (white).
