
Figure 3. Hippo signaling and YAP activation are impaired in aged mice.
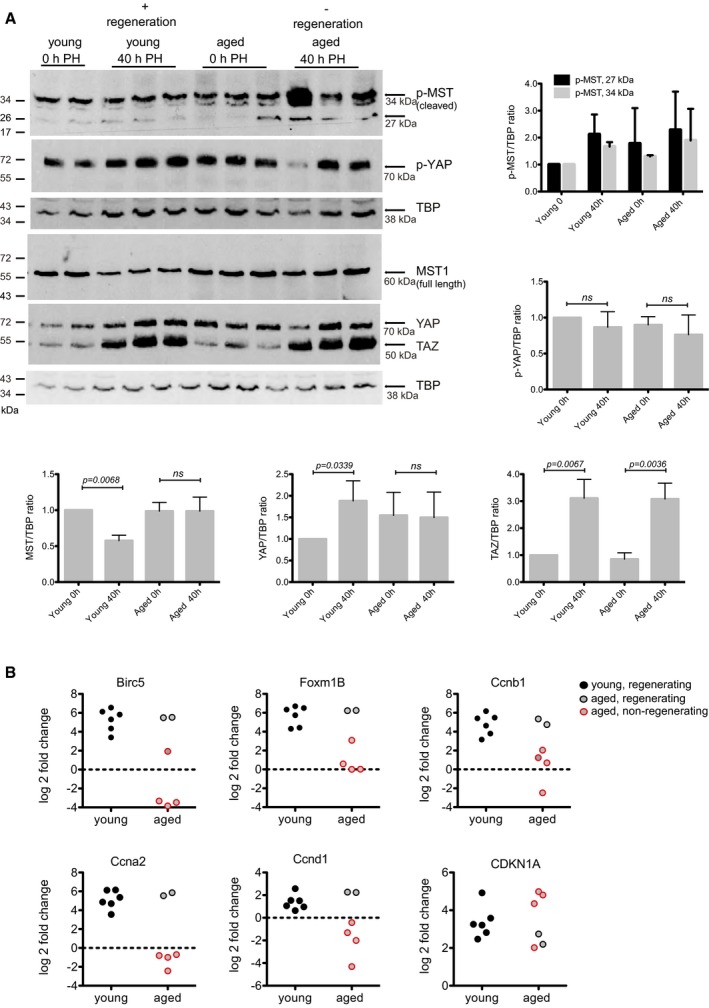
- Western blot detection of p‐MST1, MST, p‐YAP, YAP and TAZ in control and 40 h following PH in young and aged mice. TBP was used as a loading control. Representative results from a single experiment with n = 6 independent animals. Each band is from an independent animal. Western blot quantification ratios are graphically depicted. Protein levels were normalized to TBP and mean value of the group is plotted. Unpaired, two‐tailed Student's t‐test was used to calculate the significance between 0 h (resected liver) and 40 h following PH. Bars represent mean ± SD.
- RT–PCR analysis of RNA isolated from mouse liver for Foxm1B, Birc5 and Ccnb1, Ccna2, Ccnd1 and Cdkn1A. RT–PCR data are presented as log2 fold change and each value post‐PH was calculated for each mouse by comparison with its resected liver lobe. Circle with red outline marks the aged non‐regenerating livers as shown in Fig 2B. Each dot is representing an independent animal.
Source data are available online for this figure.