
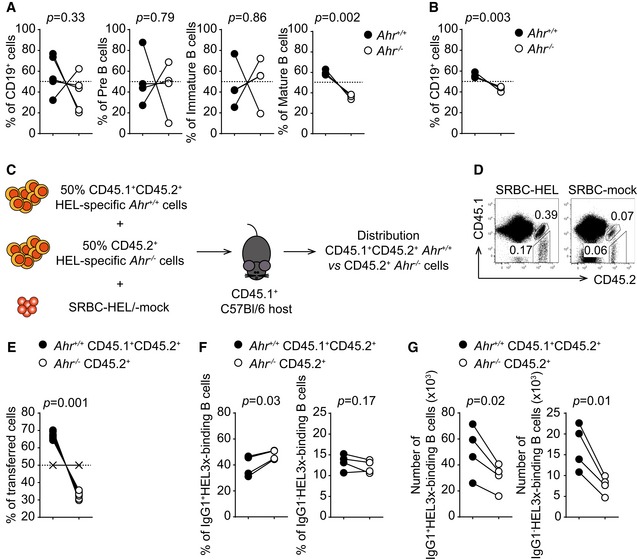
Figure 5. AhR deficiency impairs BCR‐dependent B‐cell proliferation in vivo .
-
A, BFlow cytometry analysis of distribution of CD45.1+ and CD45.2+ cells in indicated cell subsets purified from bone marrow (A) and lymph node (B) of sublethally irradiated Rag1 −/− mice 8 weeks after reconstitution with equal numbers of bone marrow cells from Ahr +/+ (CD45.1+) and Ahr −/− (CD45.2+) mice. Dashed lines indicate 50% level. Representative data of n = 2 independent experiments; two‐tailed paired t‐test.
-
CHost CD45.1 mice were co‐transferred with a 1:1 mixture of HEL‐specific Ahr +/+ CD45.1+CD45.2+ splenocytes isolated from SW HEL Ahr +/+ mice and HEL‐specific Ahr −/− CD45.2+ splenocytes isolated from SW HEL Ahr −/− mice in the presence of SRBC‐HEL or SRBC‐mock. Readout at d7 post‐challenge was distribution of Ahr +/+ CD45.1+CD45.2+ vs. Ahr −/− CD45.2+ cells.
-
DFlow cytometry analysis of distribution of CD45.1+CD45.2+ and CD45.2+ cells harvested from host mice challenged as indicated above the dot plots. Representative data of n = 3 independent experiments.
-
EFlow cytometry analysis of distribution of Ahr +/+ CD45.1+CD45.2+ (black) and Ahr −/− CD45.2+ (white) cells harvested from host mice. Indicated distribution is quantified relative to transferred cells. X symbols indicate SRBC‐mock‐treated control. Dashed line indicates 50% threshold. Representative data of n = 3 independent experiments; two‐tailed paired t‐test.
-
F, GFlow cytometry analysis of distribution (F) and cell numbers (G) of IgG1+ and IgG1− HEL3x‐binding Ahr +/+ CD45.1+CD45.2+ (black) and Ahr −/− CD45.2+ (white) cells harvested from host mice. Representative data of n = 2 independent experiments; two‐tailed paired t‐test.