
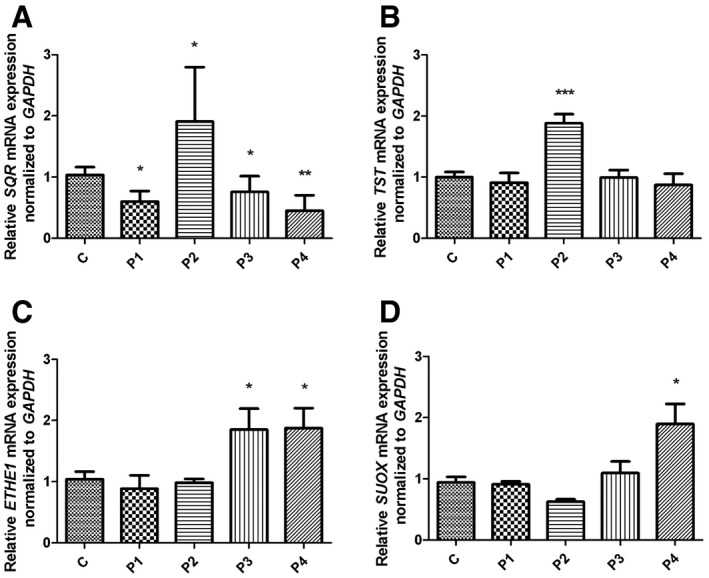
Figure EV1. SQR, TST, ETHE1, and SUOX mRNA transcript levels in patient fibroblasts.
-
A–DRelative levels of (A) SQR, (B) TST, (C) ETHE1, and (D) SUOX transcripts normalized to GAPDH in control (C, n = 5) and patient fibroblasts (P1–P4). Error bars represent SDs of three experiments. Mann–Whitney U‐test. * indicates a value of P < 0.05, ** indicates a value of P < 0.01, and *** indicates a value of P < 0.001.