
Figure 3. Sulfide respiration in fibroblasts.
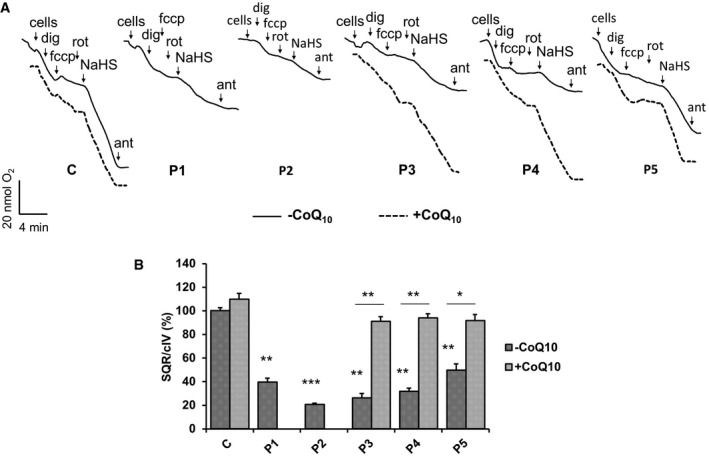
- Representative traces showing SQR‐driven oxygen consumption in 3 × 10⁶ control (C) and five patient fibroblast lines (P1–P5) in the absence (solid traces) or presence (dashed traces) of CoQ10 in the culture medium. See Materials and Methods for the role and concentration of the compounds used. Dig = digitonin, Rot = rotenone, fccp = carbonylcianide‐p‐trifluoromethoxyphenylhydrazone, Ant = antimycin, NaHS = sodium hydrosulfide.
- Relative rates of SQR‐driven oxygen consumption are normalized to CIV respiration rates. Error bars represent SDs of two experiments. Two‐tailed Student's t‐test. * indicates a value of P < 0.05, ** indicates a value of P < 0.01, and *** indicates a value of P < 0.001.