
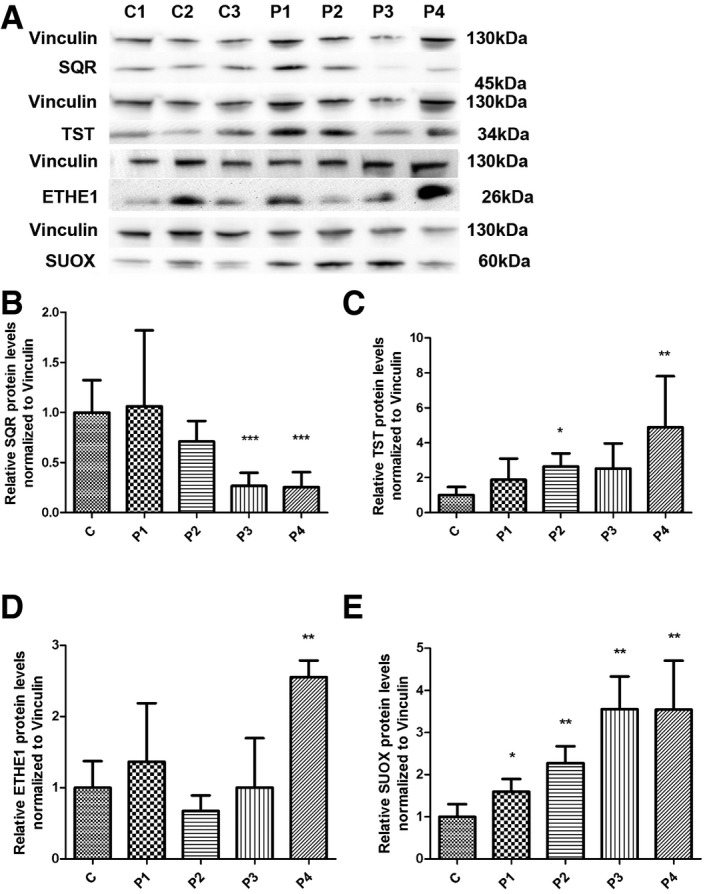
Figure 4. SQR, TST, ETHE1, and SUOX protein levels in fibroblasts.
-
ARepresentative Western blot showing the levels of SQR, TST, ETHE1, and SUOX proteins in three control (C1–C3) and four patient fibroblast lines (P1–P4).
-
B–ERelative levels of proteins normalized to vinculin. Error bars represent SDs of three experiments. Mann–Whitney U‐test. * indicates a value of P < 0.05, ** indicates a value of P < 0.01, and *** indicates a value of P < 0.001.
Source data are available online for this figure.