-
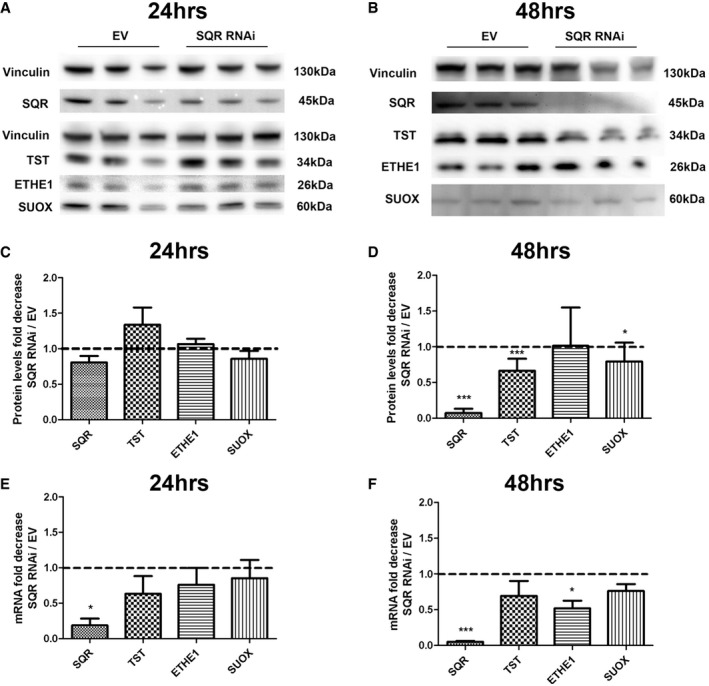
A, B
Representative Western blots showing the level of SQR, TST, ETHE1, and SUOX proteins in control (EV) and SQR‐depleted cells (SQR RNAi) after 24 h (A) and 48 h (B) of treatment.
-
C, D
Proteins are normalized to vinculin and represented as fold decrease compared with controls.
-
E, F
SQR, TST, ETHE1, and SUOX transcripts normalized to GAPDH and represented as fold decrease in SQR‐depleted compared with control (EV) cell lines.
Data information: Error bars in (C–F) represent SDs of three experiments. Mann–Whitney
U‐test. * indicates a value of
P <
0.05, and *** indicates a value of
P <
0.001.
Source data are available online for this figure.