
Figure EV5. SQR, TST, ETHE1, and SUOX mRNA transcript levels in Pdss2 kd/kd mice.
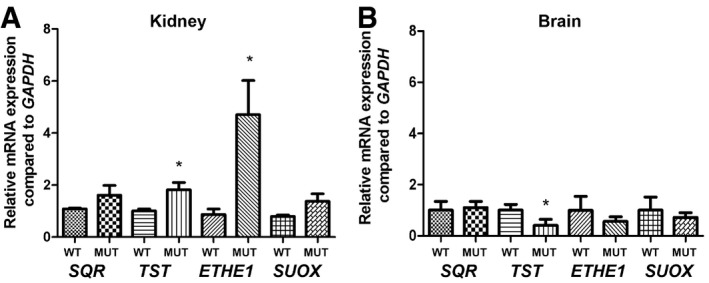
- Transcript levels in kidneys of wild‐type (WT) and mutant (Mut) mice.
- Transcript levels in brains of wild‐type (WT) and mutant (Mut) mice.
Official websites use .gov
A
.gov website belongs to an official
government organization in the United States.
Secure .gov websites use HTTPS
A lock (
) or https:// means you've safely
connected to the .gov website. Share sensitive
information only on official, secure websites.