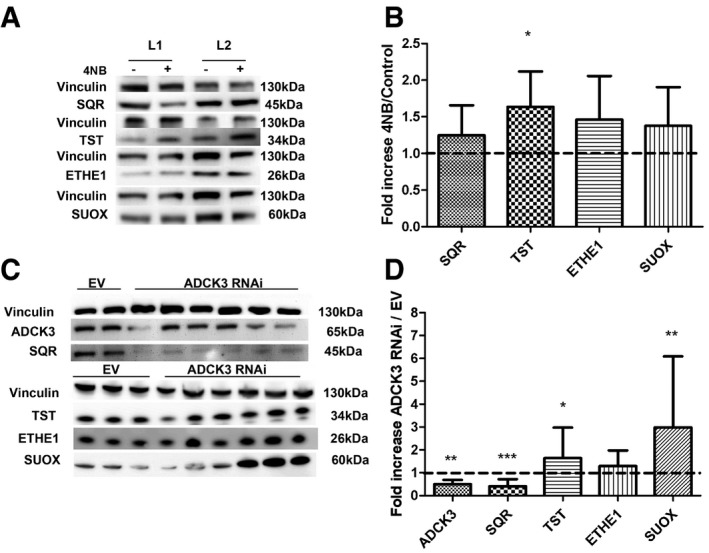
Representative Western blots showing SQR, TST, ETHE1, and SUOX of two control fibroblast lines treated with DMSO (−) or with DMSO + 4‐NB (+).
Quantification of protein levels in fibroblasts treated with 4‐NB relative to control.
Representative Western blots showing ADCK3, SQR, TST, ETHE1, and SUOX in two control (EV) and six ADCK3‐depleted clones (ADCK3 RNAi).
Quantification of protein levels in ADCK3‐depleted clones (ADCK3 RNAi) relative to controls (EV).
Data information: Error bars in (B, D) represent SDs of at least three experiments with different cell lines. Paired
t‐test in (B). Mann–Whitney
U‐test in (D). * indicates a value of
P <
0.05, ** indicates a value of
P <
0.01, and *** indicates a value of
P <
0.001.
Source data are available online for this figure.