
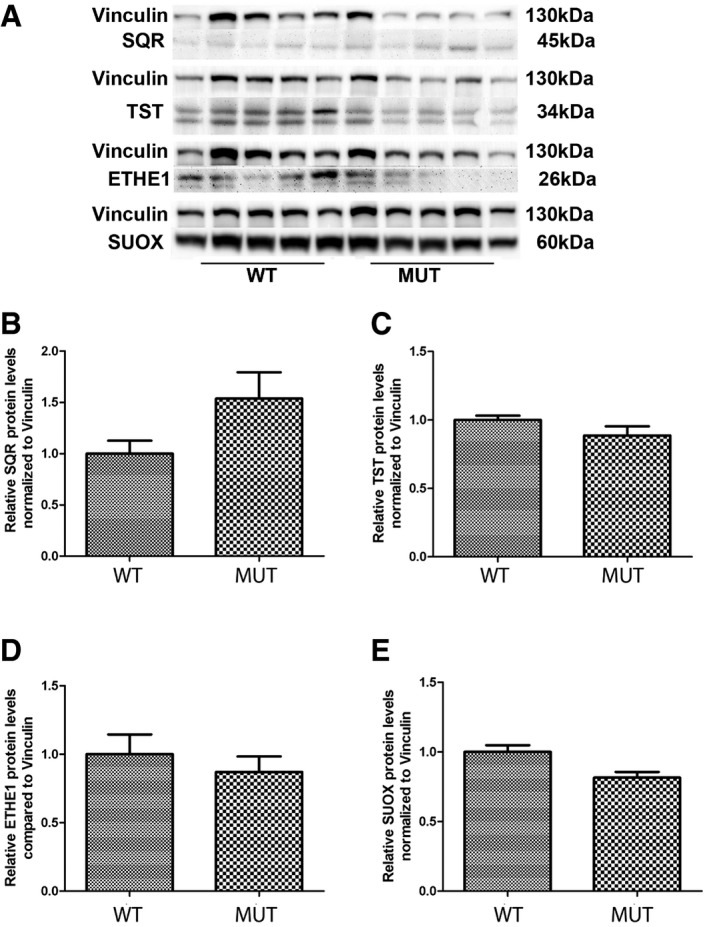
Figure 9. SQR, TST, ETHE1, and SUOX protein levels in brain of Pdss2 kd/kd mice.
-
ARepresentative Western blots showing the levels of SQR, TST, ETHE1, and SUOX protein in the brain of five wild‐type (WT) and five mutant (Mut) mice.
-
B–ERelative levels of proteins normalized to vinculin. Error bars represent SDs of five animals per group. Mann–Whitney U‐test.
Source data are available online for this figure.