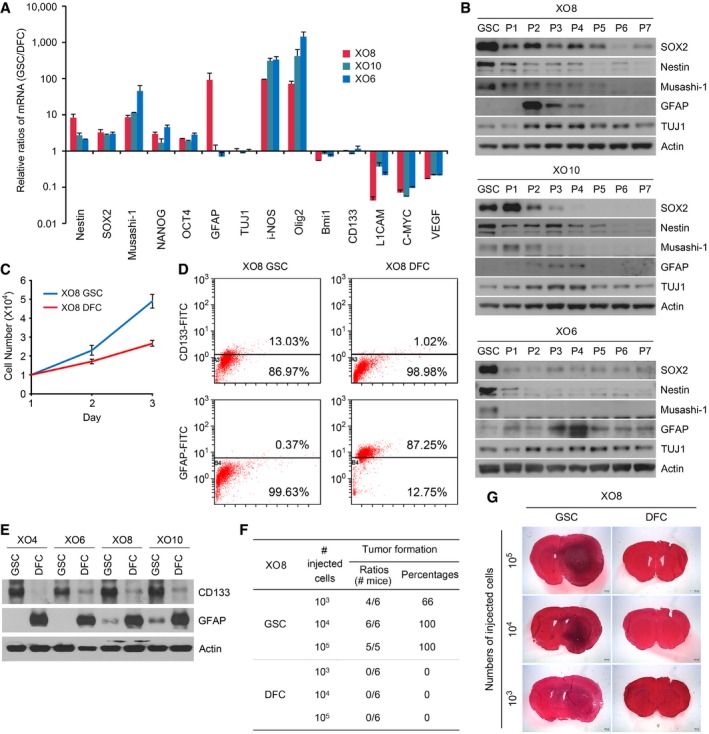
Figure 1. Validation of the in vitro culture model of GSCs.

- GSCs contain the higher levels of stemness markers (Nestin, SOX2, Musashi‐1, NANOG, and OCT4) compared with their DFCs. Total RNAs from GSCs and DFCs were subjected to real‐time PCR. The average relative amounts of GSCs were normalized with those of DFCs. Shown are means + SD values of the normalized mRNA levels of GSCs obtained from the three independent experiments.
- Immunoblotting analysis of markers for stemness (SOX2, Nestin, and Musashi‐1) and differentiation [GFAP and TUJ1 (neuron‐specific class III beta‐tubulin)] in GSCs in comparison with GSC‐derived cells at different passage numbers (P1–P7).
- Measurement of the cell doubling time. Approximately 3 × 10⁴ cells for each of XO8 GSCs and XO8 DFCs were seeded in a 60‐mm culture dish and counted every day. The cells were treated with trypsin–EDTA, and the number of viable cells was counted with a hemocytometer. The doubling time was calculated from the cell growth curve over 5 days. Shown are means ± SD values obtained from three independent experiments.
- FACS analysis of CD133 and GFAP using X08 GSCs and DFCs. Data are from representative experiments repeated at least three times.
- Immunoblotting analysis of CD133 and GFAP in GSCs in comparison with DFCs.
- Quantitation of (G).
- Equal numbers of XO8 GSCs and DFCs were injected orthotropically into mouse brains. After 6 weeks, brains were harvested and tumorigenic potential was assessed by evaluating tumor formation. Representative microphotographs of the brain sections of mice injected with XO8 GSCs and XO8 DFC controls.
Source data are available online for this figure.
