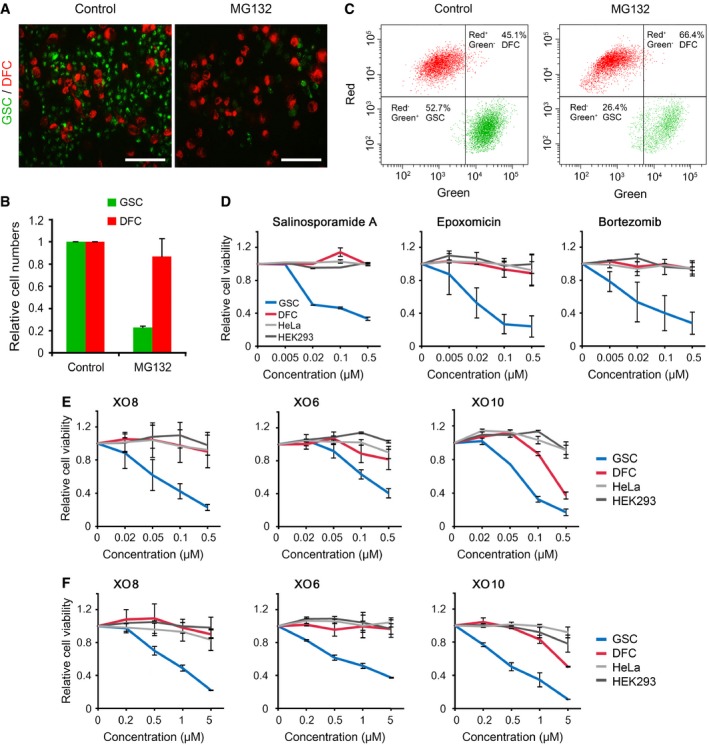
Figure 3. GSCs are hypersensitive to proteasomal inhibition.

- XO8 GSCs and DFCs were differentially labeled with PKH67 (green) and PKH26 (red), respectively, and mixed before plated on laminin‐coated plates. The cells were treated with 50 nM MG132 and subjected to fluorescent microscopy. Scale bar, 100 μm.
- Quantitation of (A). Cell numbers from three independent experiments were normalized to those of control cells treated with DMSO and presented as means + SD (P = 0.0035, n = 3). Student's t‐test (two‐sided, paired) was used for statistical analysis.
- The harvested cells from (A) were subjected to FACS analysis.
- XO8 GSCs were treated with various PIs (salinosporamide A, epoxomicin, and PS341), followed by cell viability assays. Bars, means ± SD from three independent experiments.
- XO6, XO8, and XO10 GSCs were treated with MG132 and subjected to cell viability assay. Bars, means ± SD from three independent experiments.
- XO6, XO8, and XO10 GSCs were treated with MG132 and subjected to cell viability assay in serum‐containing media. Bars, means ± SD from three independent experiments.
Source data are available online for this figure.
