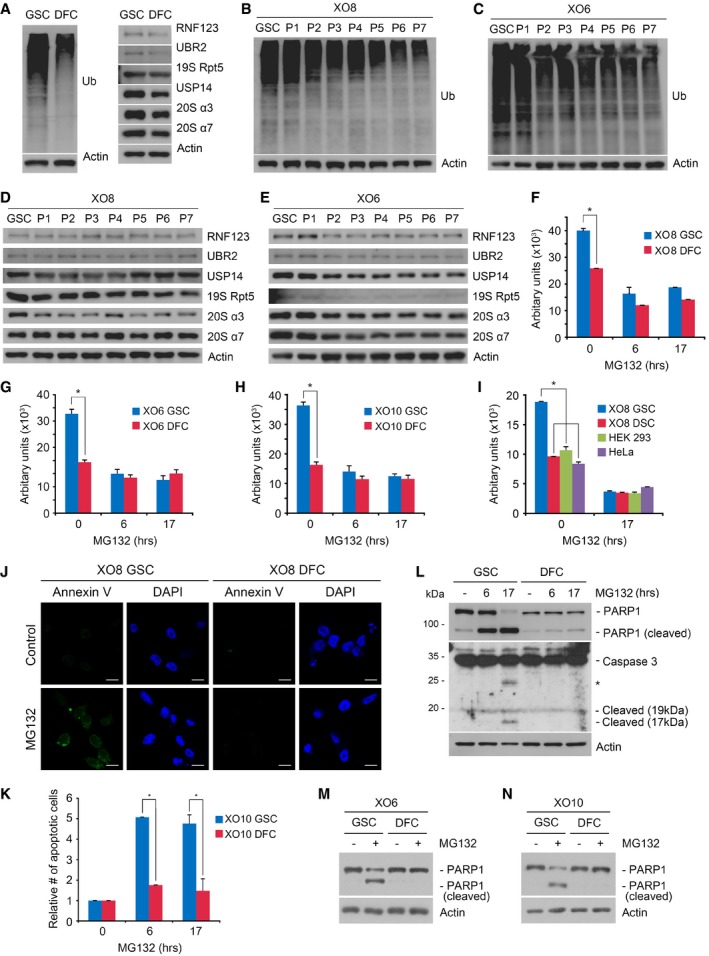
Figure 4. The stemness of GSCs correlates to increased ubiquitination, and PIs induce GSC‐specific apoptosis.

-
AImmunoblotting of XO8 GSCs and DFCs.
-
BImmunoblotting analysis of Ub in XO8 GSCs and XO8 GSC‐derived cells in the course of differentiation (P1–P7).
-
CSimilar to (B) except that XO6 GSCs were used.
-
DImmunoblotting analysis of ubiquitin ligases and proteasomal subunits in XO8 GSCs and XO8 GSC‐derived cells in the course of differentiation (P1–P7).
-
ESimilar to (C) except that XO6 GSCs were used.
-
F–IIn vitro proteasome activity assays were performed as described in the Materials and Methods. Bars represent means + SD from three independent experiments. For statistical analysis, Student's t‐test (two‐sided, paired) was used. *P‐values: (F) 0.0039; (G) 0.0052; (H) 0.0009, (I) DFC, 0.00032; HEK293, 0.0039; HeLa, 0.00051.
-
JXO8 GSCs and XO8 DFCs treated with MG132 as described in the Materials and Methods were labeled with Annexin V and visualized using fluorescent microscopy. Scale bar, 100 μm.
-
KCells from (J) were subjected to flow cytometry analysis. Annexin V‐positive cell numbers were obtained from three independent experiments and normalized to those of controls cells treated with DMSO. Bars, means + SD from three independent experiments. For statistical analysis, Student's t‐test (two‐sided, paired) was used. *P‐values: 6 h, 0.0012; 17 h, 0.0041.
-
LCells treated with 50 nM MG132 were subjected to immunoblotting analysis of apoptotic markers. Asterisk indicates non‐specific band.
-
M, NSimilar to (L) except that XO6 and XO10 cells were used.
Source data are available online for this figure.
