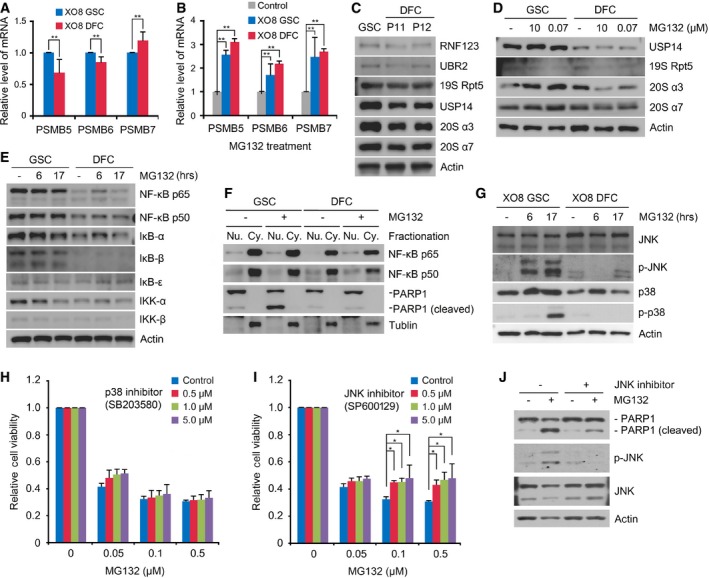
Figure 5. Analysis of the mRNA expression of proteasomal subunits and the NF‐κB pathway in GSCs.

- Real‐time PCR analysis of the proteasomal subunits PSMB5, PSMB6, and PSMB7 in XO8 GSCs and XO8 DFCs. Shown are means + SD values from the three independent experiments following normalization to those of GSCs. For statistical analysis, Student's t‐test (two‐sided, paired) was used. **P‐values: PSMB5, 0.053; PSMB6, 0.034; PSMB7, 0.067.
- Similar to (A) except that the cells were treated with 50 nM MG132 for 17 h. Shown are means + SD values from the three independent experiments following normalization to those of control cells treated with DMSO. For statistical analysis, Student's t‐test (two‐sided, paired) was used. **P‐values: PSMB5, 0.022; PSMB6, 0.08; PSMB7, 0.603.
- Same as (C) except that the cells were treated with MG132 for 17 h.
- Immunoblotting analysis of the NF‐κB pathway in XO8 GSCs and XO8 DFCs.
- Fractionation analysis of NF‐κB in XO8 GSCs and XO8 DFCs treated with 50 nM MG132 for 17 h. PARP1 and tubulin were used as markers for the nucleus and cytoplasm, respectively.
- Immunoblotting analysis of JNK and p38.
- Cell viability assay was performed as in Fig 2 with cells treated with MG132 alone or in combination with SB203580. Shown are means + SD values from three independent experiments following normalization to those of control cells treated with DMSO. For statistical analysis, Student's t‐test (two‐sided, paired) was used. P‐values: 0.724, 0.502, 0.439 for 0.5, 1.0, and 5.0 μM SB203580, respectively, at 0.1 μM MG132, and 0.760, 0.683, 0.498 for 0.5, 1.0, and 5.0 μM SB203580, respectively, at 0.5 μM MG132.
- Experimental conditions were similar to (H) except that SP600129 was used. Shown are means + SD values from three independent experiments following normalization to those of control cells treated with DMSO. For statistical analysis, Student's t‐test (two‐sided, paired) was used. *P‐values: 0.009, 0.002, 0.07 for 0.5, 1.0, and 5.0 μM SP600129, respectively, at 0.1 μM MG132, and 0.018, 0.025, 0.09 for 0.5, 1.0, and 5.0 μM SP600129, respectively, at 0.5 μM MG132.
- Immunoblotting analysis of XO8 GSCs treated with 50 nM MG132 alone or in combination with the JNK inhibitor SP600129.
