-
A
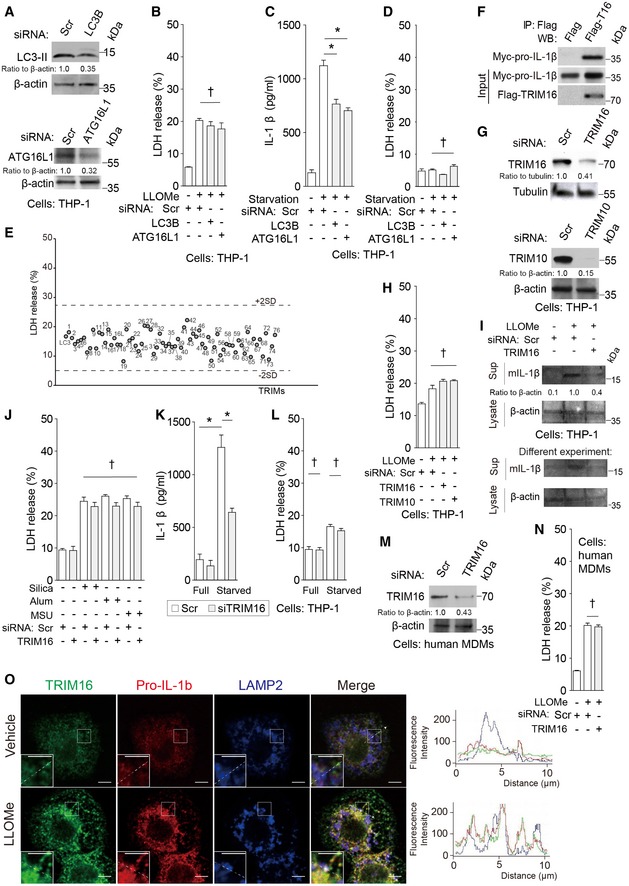
Knockdown efficacies as determined by immunoblots.
-
B
LDH release data for samples in Fig
1A.
-
C, D
Levels of (C) IL‐1β and (D) LDH release were determined in supernatants from THP‐1 cells subjected to knockdowns as indicated, treated with 100 ng/ml LPS overnight, then starved in EBSS for 3 h.
-
E
LDH release results for samples in Fig
1C.
-
F
Co‐IP analysis of interactions between flag‐TRIM16 with myc‐pro‐IL‐1β in HEK293T cells.
-
G
Immunoblot analyses of knockdown efficacies in THP‐1 cells.
-
H
LDH release data for samples in Fig
1E.
-
I
Immunoblot analyses of the levels of mIL‐1β in supernatants from THP‐1 cells that were subjected to knockdown as indicated and were sequentially treated with LPS and LLOMe.
-
J
LDH release data from samples in Fig
1F.
-
K, L
Levels of (K) IL‐1β and (L) LDH release was determined in supernatants from THP‐1 cells subjected to knockdown as indicated, treated with 100 ng/ml LPS overnight, then starved in EBSS for 3 h.
-
M
Immunoblot analyses of knockdown efficacies in primary human MDM cells.
-
N
LDH release results for samples in Fig
1G.
-
O
Intracellular localization analysis of TRIM16, pro‐IL‐1β, and LAMP2 by confocal microscopy. Cells, THP‐1. Line tracings correspond to arrows. Scale bars, 5 μm.
Data information: Means ± SEM;
n ≥ 5, except for immunoblot quantifications and TRIM screen where
n ≥ 3. *
P <
0.05,
†
P ≥
0.05 (
t‐test for N; ANOVA for B, C, D, H, J, K, L).