-
A, B
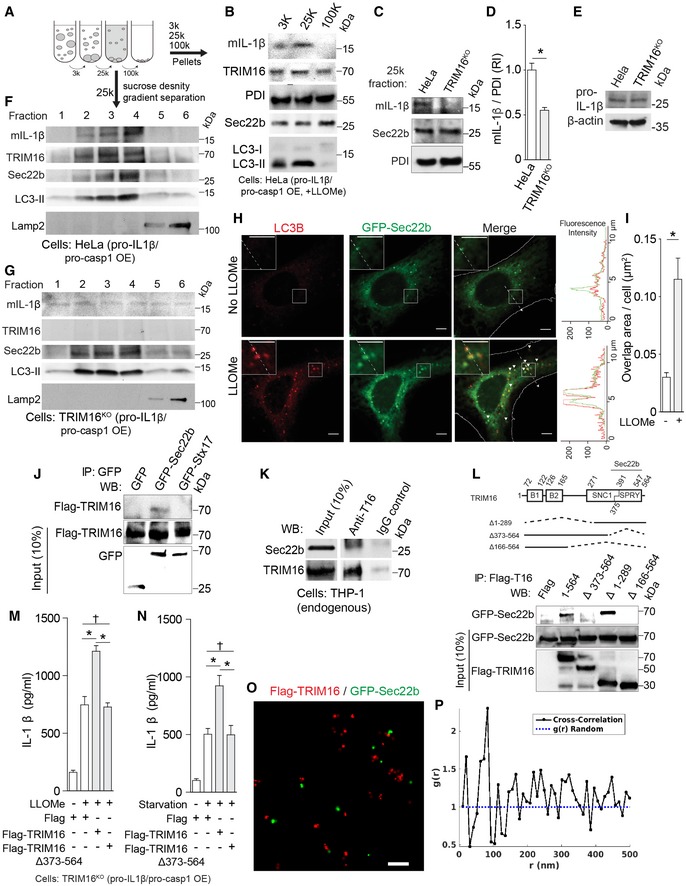
Immunoblot analyses of indicated membrane fractions prepared by differential centrifugation. HeLa cells reconstituted with flag‐pro‐IL‐1β and myc‐pro‐caspase‐1 were treated with 1 mM LLOMe for 1 h, and lysates were subjected to differential centrifugations at 3,000 g (3 k), 25,000 g (25 k) and 100,000 g (100 k) as depicted in the cartoon. Arrows, two ways the membranes were analyzed—pellets from velocity sedimentation were analyzed in panels (B–D), or by further sucrose and OptiPrep density separation of 25 k pellets in panels (F, G).
-
C
IL‐1β levels in 25 k membrane fractions (pellets) from HeLa cells and their CRISPR knockout derivatives (TRIM16KO) that were reconstituted for IL‐1β secretion and treated with 1 mM LLOMe for 1 h.
-
D
Quantification of analyses in (C). RI, relative intensity.
-
E
Whole‐cell lysates (immunoblots) analyzed in (F, G).
-
F, G
Sucrose density gradient analysis of 25 k membranes. Note that mature IL‐1β (mIL‐1β) is recruited to and co‐fractionates with TRIM16+, Sec22b+, and LC3‐II+ membranes in TRIM16wt HeLa cells reconstituted with pro‐IL‐1β and pro‐caspase‐1, but not in TRIM16KO mutant cells.
-
H
Confocal images of LC3 in HeLa cells expressing GFP‐Sec22b treated with LLOMe or untreated (control). Arrowheads, colocalization. Scale bars, 5 μm.
-
I
GFP‐Sec22b and LC3 overlapping area obtained by high content microscopy.
-
J
Co‐IP analysis between flag‐TRIM16 with GFP‐Sec22b or GFP‐syntaxin 17 co‐expressed in HEK293T cells.
-
K
Co‐IP analysis of endogenous proteins, TRIM16 and Sec22b, in lysates from THP‐1 cells treated with LLOMe.
-
L
Co‐IP analysis of interactions between deletion variants of flag‐TRIM16 with GFP‐Sec22b in HEK293T cells.
-
M, N
IL‐1β secretion complementation experiments of TRIM16KO cells with TRIM16 Sec22b‐interacting and its Sec22b‐non‐binding mutant shown.
-
O
Two color super‐resolution image showing co‐clustering of flag‐TRIM16 (red) and GFP‐Sec22b (green). Scale bar, 200 nm.
-
P
Cross‐correlation analysis of flag‐TRIM16 and GFP‐Sec22b super‐resolution data showing a characteristic separation of ˜70 nm.
≥ 3. *
‐test for D, I; ANOVA for M, N).