-
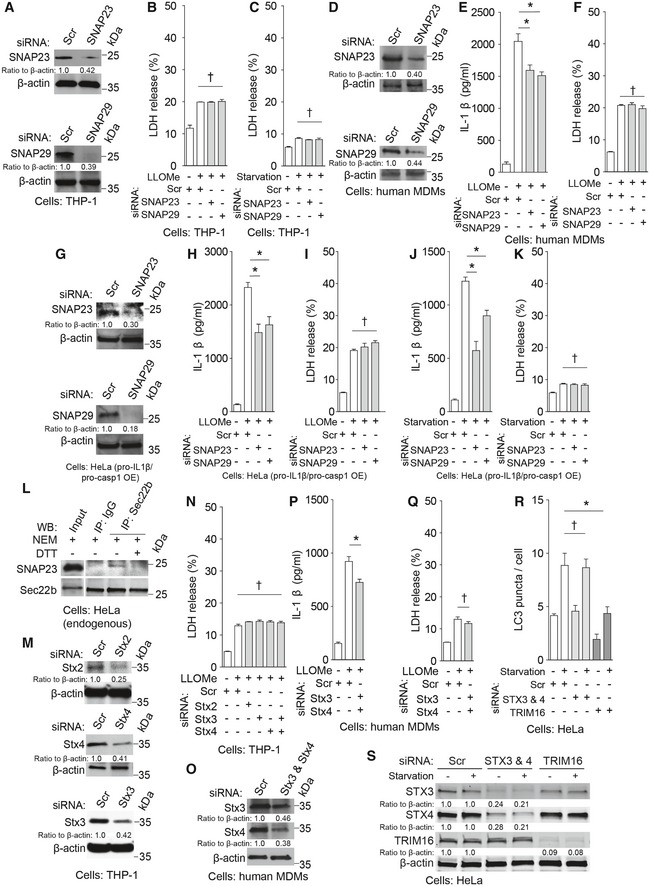
A
Immunoblot analyses of knockdown efficacies in THP‐1 cells.
-
B, C
LDH release data for (B) Fig
5A and (C) Fig
5B.
-
D
Immunoblot analyses of knockdown efficacies in primary human MDM cells.
-
E, F
Levels of (E) IL‐1β and (F) LDH release determined in supernatants from primary human MDM cells that were subjected to knockdowns as indicated and were sequentially treated with LPS and LLOMe.
-
G
Immunoblot analyses of knockdown efficacies in HeLa cells.
-
H, I
Levels of (H) IL‐1β and (I) LDH release were determined in supernatants from HeLa cells reconstituted for IL‐1β secretion and treated with LLOMe.
-
J, K
Levels of (J) IL‐1β and (K) LDH release were determined in supernatants from HeLa cells reconstituted for IL‐1β secretion and starved in EBSS.
-
L
Co‐IP analysis between SNAP‐23 with Sec22b in lysates from HeLa cells treated with NEM and DTT as indicated.
-
M
Immunoblot analyses of knockdown efficacies in THP‐1 cells.
-
N
LDH release data from Fig
5C.
-
O
Immunoblot analyses of knockdown efficacies in primary human MDM cells.
-
P, Q
Levels of (P) IL‐1β and (Q) LDH release determined in supernatants from primary human MDM cells that were subjected to knockdowns as indicated and were sequentially activated with LPS and treated with LLOMe.
-
R
Conventional autophagy response to starvation measured by LC3 puncta (HC imaging and analysis) in HeLa cells knocked down as indicated.
-
S
Knockdown efficacies in cells corresponding to panel (R).
Data information: Means ± SEM;
n ≥ 5, except for immunoblot quantifications where
n ≥ 3. *
P <
0.05,
†
P ≥
0.05 (
t‐test for P, Q; ANOVA for B, C, E, F, H–K, N, R).