
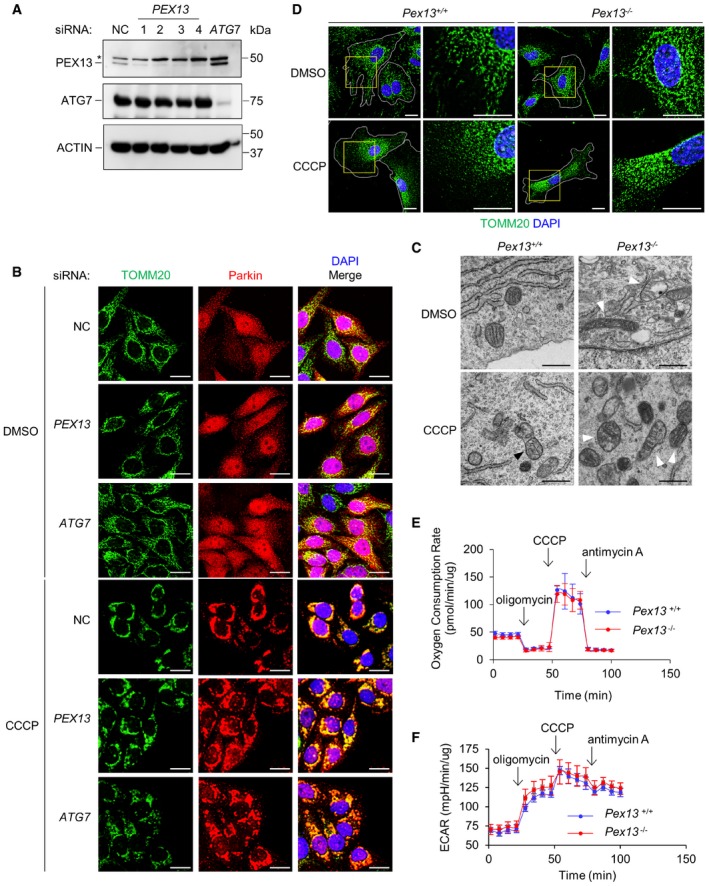
Figure EV2. PEX13 colocalization with Parkin during mitophagy and analysis of mitochondrial morphology and metabolism in Pex13 −/− MEFs.
-
AWestern blot detection of PEX13 and ATG7 in HeLa/Parkin cells transfected with the indicated siRNA. Asterisk denotes nonspecific band.
-
BRepresentative images of Parkin colocalization with TOMM20 in HeLa/Parkin cells treated with indicated siRNA after treatment with DMSO or 10 μM CCCP for 4 h. Scale bars, 20 μm.
-
CTransmission electron microscopic analysis of MEFs in control conditions or following CCCP‐induced mitochondrial damage. Shown are representative images of mitochondrial morphology in MEFs of the indicated genotype 24 h after treatment with 30 μM CCCP or DMSO vehicle control. Black arrowhead denotes autolysosome containing damaged mitochondria; white arrowheads denote mitochondria with abnormal cristae morphology. Scale bars, 500 nm.
-
DRepresentative images of TOMM20 staining in MEFs of the indicated genotype with DMSO or 30 μM CCCP for 24 h. Insets show reticular mitochondrial morphology during basal state and fragmented damaged mitochondria after CCCP treatment. White lines indicate cell borders. Scale bars, 20 μm.
-
E, FMitochondrial metabolism assay in primary MEFs of the indicated genotype. Mitochondrial oxygen consumption rate normalized to total protein level (E) and extracellular acidification rate (ECAR) adjusted to total protein level (F) are shown. Plot shows the average and SEM of 5 samples.
Source data are available online for this figure.