
Figure 3. siRNA‐resistant WT PEX13, but not disease‐associated mutants PEX13 I326T and W313G rescue the mitophagy defect in PEX13 knockdown cells.
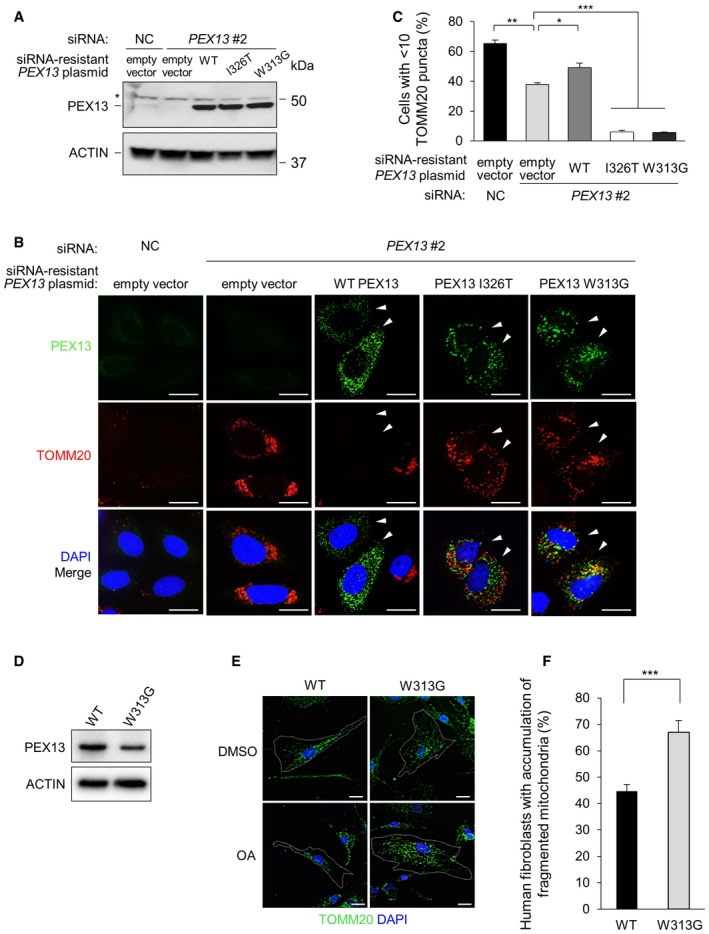
- Western blot detection of PEX13 in HeLa/Parkin cells transfected with indicated siRNA and siRNA‐resistant PEX13 plasmid. To achieve similar PEX13 protein expression levels, 0.75 μg PEX13 I326T and PEX13 W313G plasmids were transfected compared with 0.25 μg WT PEX13. Total plasmid level was adjusted using empty vector. Asterisk denotes nonspecific band.
- Representative images of Parkin‐mediated clearance of TOMM20 in HeLa/Parkin cells treated with PEX13 siRNA and transfected with indicated PEX13 siRNA‐resistant plasmid and then treated with CCCP (10 μM, 16 h). Arrowheads indicate cells expressing exogenous PEX13. Scale bars, 20 μm. See Fig EV3B for representative images of mitochondrial morphology (TOMM20 staining) in control cells treated with DMSO.
- Quantification of experiment shown in (B). Results represent mean ± SEM of triplicate samples (˜100 cells analyzed per sample). Similar results were observed in three independent experiments. *P < 0.05, **P < 0.01,***P < 0.001; two‐tailed unpaired t‐test.
- Western blot detection of PEX13 expression in wild‐type (WT) and PEX13 W313G (W313G) mutant primary human fibroblasts.
- Representative images of Parkin‐mediated clearance of TOMM20 in wild‐type (WT) and PEX13 W313G (W313G) mutant primary human fibroblasts treated with oligomycin (2.5 μM) + antimycin A (250 nM) for 24 h. Scale bars, 20 μm. W313G cells varied in morphology; outlined cell in upper right panel shows a representative cell with larger size and abnormal mitochondrial morphology (see Fig EV3C for higher resolution imaging) and outlined cell in lower right panel shows a representative cell with accumulation of fragmented mitochondria that would be scored as positive in (F).
- Quantification of experiment shown in (E). Results represent mean ± SEM of five groups of 10 images of random fields of cells (> 350 cells analyzed per sample). Similar results were observed in two independent experiments. ***P < 0.0001; two‐tailed unpaired t‐test.
Source data are available online for this figure.