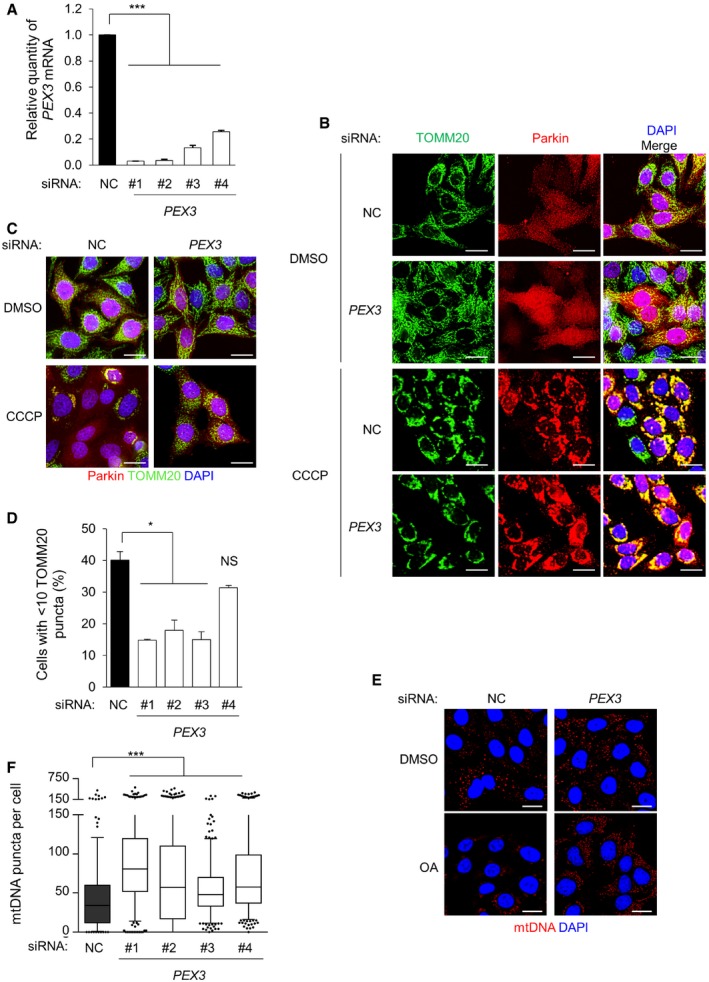
Quantitative real‐time PCR of PEX3 mRNA detection in HeLa/Parkin cells transfected with indicated siRNA. Results represent mean ± SEM of triplicate samples. Similar results were observed in three independent experiments. ***P < 0.001; one‐way ANOVA with adjustment for multiple comparisons.
Representative images of Parkin colocalization with TOMM20 in HeLa/Parkin cells treated with indicated siRNA after treatment with DMSO or 10 μM CCCP for 4 h. Scale bars 20 μm.
Representative images of Parkin‐mediated clearance of TOMM20 in HeLa/Parkin cells transfected with indicated siRNA and after treatment with DMSO or 10 μM CCCP for 16 h. Scale bars, 20 μm.
Quantification of TOMM20 clearance in the experiment shown in (C). Results represent mean ± SEM of triplicate samples (˜100 cells analyzed per sample). Similar results were observed in more than three independent experiments. *P < 0.05, *** P < 0.001, NS = not significant; one‐way ANOVA with adjustment for multiple comparisons.
Representative images of Parkin‐mediated clearance of mtDNA after 8 h of treatment with 2.5 μM oligomycin and 250 nM antimycin A (OA) or DMSO vehicle control in HeLa/HA‐Parkin cells treated with indicated siRNA. siPEX3 oligo #1 is shown; similar results were observed with three other siPEX3 oligos. Nuclear DNA staining was masked using DAPI. Scale bars, 20 μm.
Quantification of mtDNA clearance in the experiment shown in (E). Results represent box plots of ˜300 cells analyzed per sample. Whiskers represent 5–95% range and the horizontal lines of the boxes indicate the 25th, 50th, and 75th percentiles of the dataset. Each outlier is represented by a dot. Similar results were observed in three independent experiments. ***P < 0.001; Kruskal–Wallis H‐test.