
Figure 5. PEX13 and PEX3 are required for selective mitophagy, whereas PEX14 and PEX19 are required for general autophagy.
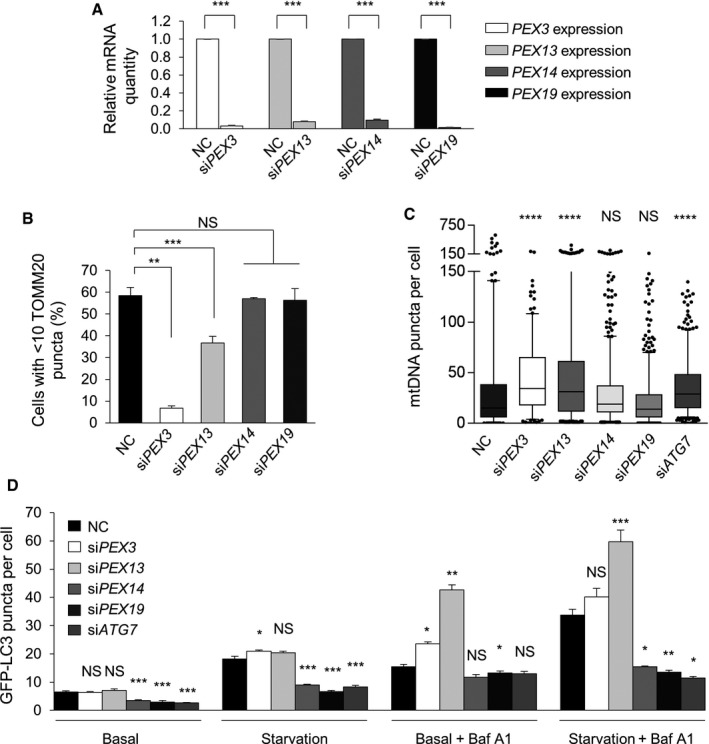
- Quantitative real‐time PCR detection of mRNA levels for PEX3, PEX13, PEX14, and PEX19 in HeLa cells transfected with the indicated siRNA. Results represent mean ± SEM of triplicate samples. Similar results were observed in three independent experiments. ***P < 0.001; two‐tailed unpaired t‐test.
- Quantification of Parkin‐mediated TOMM20 clearance in HeLa/Parkin cells transfected with the indicated siRNA 16 h after treatment with 10 μM CCCP. Results represent mean ± SEM of triplicate samples (˜100 cells analyzed per sample). Similar results were observed in three independent experiments. **P < 0.01, ***P < 0.001; one‐way ANOVA with adjustment for multiple comparisons.
- Quantification of mtDNA clearance in HeLa/HA‐Parkin cells transfected with the indicated siRNA 8 h after treatment with 2.5 μM oligomycin and 250 nM antimycin A (OA). Results represent box plots of ~300 cells analyzed per sample. Whiskers represent 5–95% range and the horizontal lines of the boxes indicate the 25th, 50th, and 75th percentiles of the dataset. Each outlier is represented by a dot. Similar results were observed in three independent experiments. ****P < 0.0001, NS = not significant; Kruskal–Wallis H‐test.
- Quantification of GFP‐LC3 puncta in HeLa/GFP‐LC3 cells treated with 10 nM Baf A1 or DMSO vehicle and cultured for 3 h in normal medium or HBSS starvation media. Results represent mean ± SEM in triplicate samples (˜100 cells analyzed per sample). Similar results were observed in three independent experiments. *P < 0.05, **P < 0.01, ***P < 0.001, NS = not significant; one‐way ANOVA with adjustment for multiple comparisons. Statistical analyses refer to the differences between Pex or ATG7 siRNAs vs. NC siRNA within each treatment group.