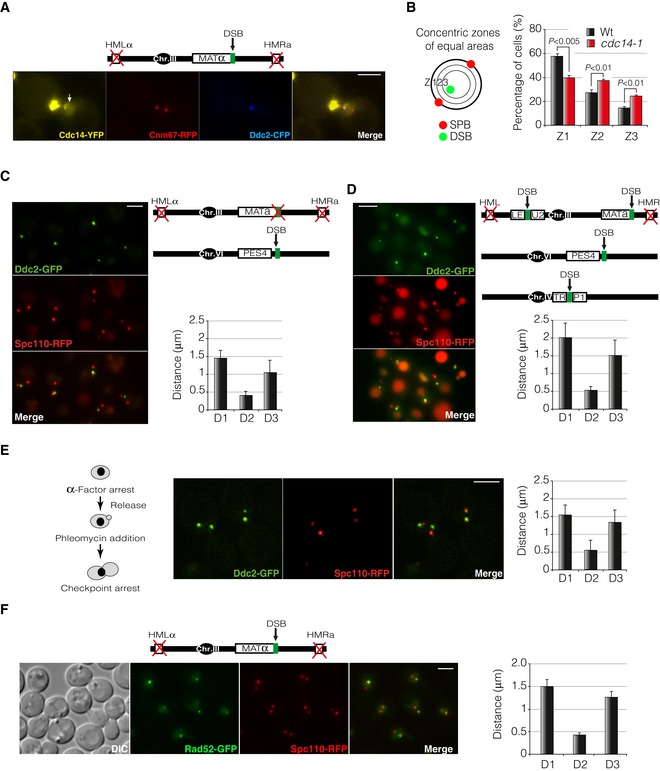
Cdc14 is released from the nucleolus into the nucleoplasm in response to a single DSB induced by the HO endonuclease. A strain carrying Cdc14‐YFP was grown in raffinose before inducing a non‐reparable DSB by expressing the HO endonuclease. Cnm67‐RFP and Ddc2‐CFP were used as SPB and DSB reporters, respectively. Arrow depicts Cdc14 signal at the nucleoplasm. Scale bar: 3 μm.
Schematic representation of the approach used to analyse DSB recruitment to the nuclear rim. The Ddc2‐GFP foci proximity to a circumference connecting both SPBs was calculated by determining the position of the DSB into three concentric zones of equal area. Graphs represent the percentage of Ddc2 foci falling into each zone. Values represent the mean ± SD of three independent experiments. At least 100 cells per experiment were scored. P‐values were calculated using a two‐tailed unpaired Student's t‐test.
Diagram depicting the genomic background used to induce a single DSB outside the MAT locus. Spc110‐RFP and Ddc2‐GFP were used as SPB and DSB markers, respectively. D1: inter‐SPB distance; D2: DSB distance to proximal SPB; D3: DSB distance to distal SPB. Graph represents the mean ± SD of D1, D2 and D3 distances of at least 100 cells scored using the maximum projection of three z‐planes. A representative picture is shown. Scale bar: 3 μm.
Diagram showing the genomic background used to induce multiple DSBs. Spc110‐RFP and Ddc2‐GFP were used as SPB and DSB markers, respectively. D1: inter‐SPB distance; D2: DSB distance to proximal SPB; D3: DSB distance to distal SPB. Graph represents the mean ± SD of D1, D2 and D3 distances of at least 100 cells scored using the maximum projection of three z‐planes. A representative picture is shown. Scale bar: 3 μm.
Diagram illustrating the workflow used to analyse DSB‐SPB recruitment of DNA lesions induced by phleomycin treatment. Phleomycin was added to a final concentration of 1 μM. Spc110‐RFP and Ddc2‐GFP were used as SPB and DSB reporters, respectively. D1: inter‐SPB distance; D2: DSB distance to proximal SPB; D3: DSB distance to distal SPB. Graph represents the mean ± SD of D1, D2 and D3 distances of at least 100 cells scored using the maximum projection of seven z‐planes. A representative picture is shown. Scale bar: 3 μm.
Rad52 foci are recruited to the SPBs in response to a non‐reparable DSB generated by expressing the HO endonuclease. Rad52‐GFP and Spc110‐RFP were used as DSB and SPB reporters, respectively. Graph represents the mean ± SD of D1, D2 and D3 distances of at least 100 cells scored using the maximum projection of nine z‐planes. Scale bar: 3 μm.
Data information: DSB, double‐strand break; SPB, spindle pole body.

