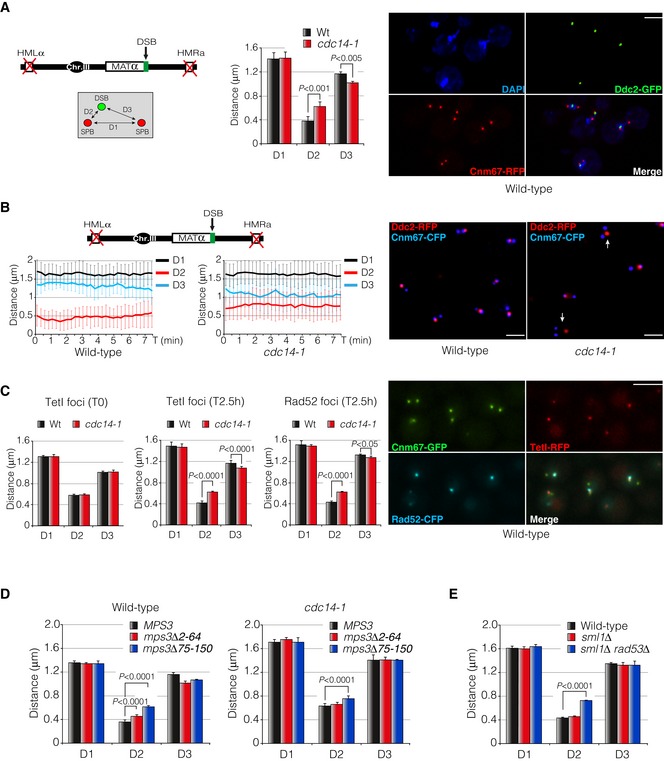
Diagram showing the genomic background and the approximation used to measure DSB‐SPB interaction. Cnm67‐RFP and Ddc2‐GFP were used as SPB and DSB markers, respectively. D1: inter‐SPB distance; D2: DSB distance to proximal SPB; D3: DSB distance to distal SPB. Graph represents the mean ± SD of D1, D2 and D3 distances from three independent experiments. At least 100 cells per experiment were scored using the maximum projection of three z‐planes. P‐values were calculated using a two‐tailed unpaired Student's t‐test. A representative picture of a wild‐type strain depicting DSB‐SPB interaction is shown. Scale bar: 3 μm.
Time‐lapse experiments in living cells showing the efficiency of DSB‐SPB interaction upon induction of a single DSB. Cnm67‐CFP and Ddc2‐RFP were used as SPB and DSB markers, respectively. D1, D2 and D3 distances in wild‐type and cdc14‐1 cells were tracked using the maximum projection of three z‐planes images at 15‐s intervals over period of 7.5 min. A total of 32 time‐lapses for each strain were measured. Graphs represent the average distance ± SD. A representative picture is shown. Examples of cells defective in DSB‐SPB interaction are marked with arrows. Scale bar: 3 μm.
An RFP‐marked I‐SceI recognition site is re‐localized to the SPBs after expressing the endonuclease. Cells harbouring a TetO array adjacent to the I‐SceI site and a plasmid containing the endonuclease under the control of the galactose promoter were grown overnight in SC‐Ade prior to galactose induction. To check reproducibility with previous results, a Rad52‐CFP was used. Cnm67 was labelled with the GFP to be used as a SPB reporter. D1, D2 and D3 distances were measured in wild‐type and cdc14‐1 mutants before and after endonuclease expression by using both TetI‐RFP and Rad52‐CFP foci using the maximum projection of nine z‐planes images. Graphs represent the average ± SD of three independent experiments. P‐values were calculated using a two‐tailed unpaired Student's t‐test. A representative picture of a wild‐type strain depicting TetI‐Rad52‐SPB interaction is shown. Scale bar: 3 μm.
DSB‐SPB tethering requires the N‐terminus domain of Mps3. Cells expressing a wild‐type Mps3, a mps3Δ2‐64 and a mps3Δ75–150 fused to the RFP as the sole source of the protein were scored for their ability to enhance DSB‐SPB tethering in both wild‐type and cdc14‐1 backgrounds. Ddc2‐YFP was used as a DSB reporter. Measurements were carried out using a maximum projection of nine z‐planes images. Graphs represent the average distribution ± SD of D1, D2 and D3 of three independent experiments. At least 100 cells for each experiment were scored. P‐values were calculated using a two‐tailed unpaired Student's t‐test.
DSB‐SPB interaction involves a proficient DNA damage checkpoint activation. D1, D2 and D3 distances were scored in wild‐type, sml1Δ and sml1Δ rad53Δ backgrounds using Ddc2‐GFP and Spc110‐RFP as DSB and SPB markers, respectively. Measurements were performed by using a maximum projection of nine z‐planes images. Graphs denote the average distribution ± SD of D1, D2 and D3 from three independent experiments where at least 100 cells for each sample were scored. P‐values were calculated using a two‐tailed unpaired Student's t‐test.
Data information: DSB, double‐strand break; SPB, spindle pole body; DAPI, 4′,6‐diamidino‐2′‐phenylindole dihydrochloride.

