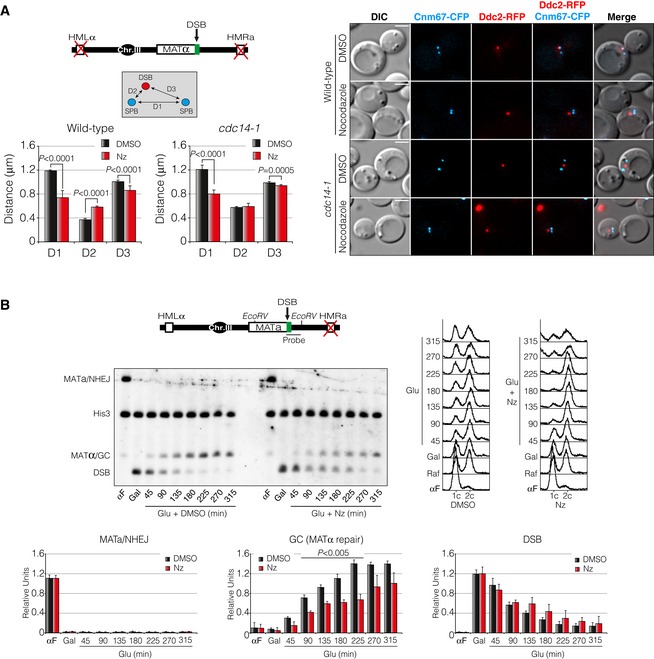
Physical analysis of wild‐type cells containing the repair pathway choice assay described in Fig
2B. The diagram with the genomic information, the restriction enzymes used and the location of the probe are shown. Cells were synchronized in G1 by using the α‐factor pheromone and released into fresh media for 1 h. Induction of HO expression was attained by adding galactose for 2 h. After formation of the DSB, glucose was added to repress the HO in the presence of nocodazole or mock DMSO and samples were taken to analyse the kinetics of the repair. DNA was extracted, digested with
EcoRV, separated on agarose gels and blotted. Both probes for the
MATa‐distal sequence and the
HIS3 gene (as a loading control) were used. FACS analyses are shown. Graphs show the quantification of
MATa restoration (NHEJ), mating‐type switching by gene conversion (HR), and DSB kinetics formation. All data were normalized with the
HIS3 gene. Graphs show the mean ± SD from three independent experiments.
P‐values were calculated using a two‐tailed unpaired Student's
t‐test.

