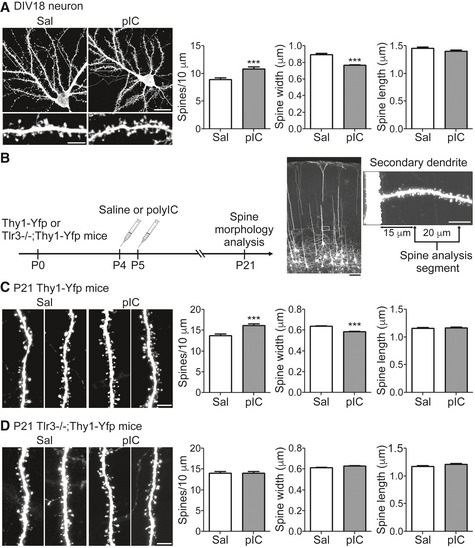
Figure 8. TLR3 activation alters spine morphology in vitro and in vivo .

-
ACortical and hippocampal mixed neuronal cultures were transfected with a GFP construct at 12 DIV and treated with poly(I:C) (pIC) at 17 DIV for 24 h. Spine morphology was examined at 18 DIV. Three secondary dendrites of each neuron were selected to analyze the spine density, the width of the spine head, and the spine length. Mean values ± SEM of representatives of three independent experiments are shown. For the saline group, 15 neurons/45 dendrites were examined; for the poly(I:C) group, 16 neurons/48 dendrites were examined. Data were analyzed by unpaired t‐test. Scale bar, 20 μm in right upper panel and 5 μm in lower left panel. ***P < 0.0001.
-
BSchematic of the experimental procedure for in vivo spine morphology analysis in (C and D). Representative images of somatosensory cortical layer 5 neurons and a high magnification image of a secondary dendrite are shown. Scale bar, 100 μm in the brain section (black) and 10 μm in the dendrite segment (white).
-
C, DSpine morphology of P21 Thy1‐Yfp (C) and Tlr3 −/−; Thy1‐Yfp mice (D) after poly(I:C) stimulation at P4 and P5. One secondary dendrite of an apical dendrite of each somatosensory layer 5 cortical neuron was selected to examine the spine morphology. Three mice were analyzed for each group. Saline‐treated Thy1‐Yfp, 44 neurons; poly(I:C)‐treated Thy1‐Yfp, 43 neurons; saline‐treated Tlr3 −/− ;Thy1‐Yfp, 46 neurons; poly(I:C)‐treated Tlr3 −/− ;Thy1‐Yfp, 50 neurons. Mean values ± SEM are shown. Data were analyzed by unpaired t‐test. Scale bars, 5 μm. ***P < 0.0001.
