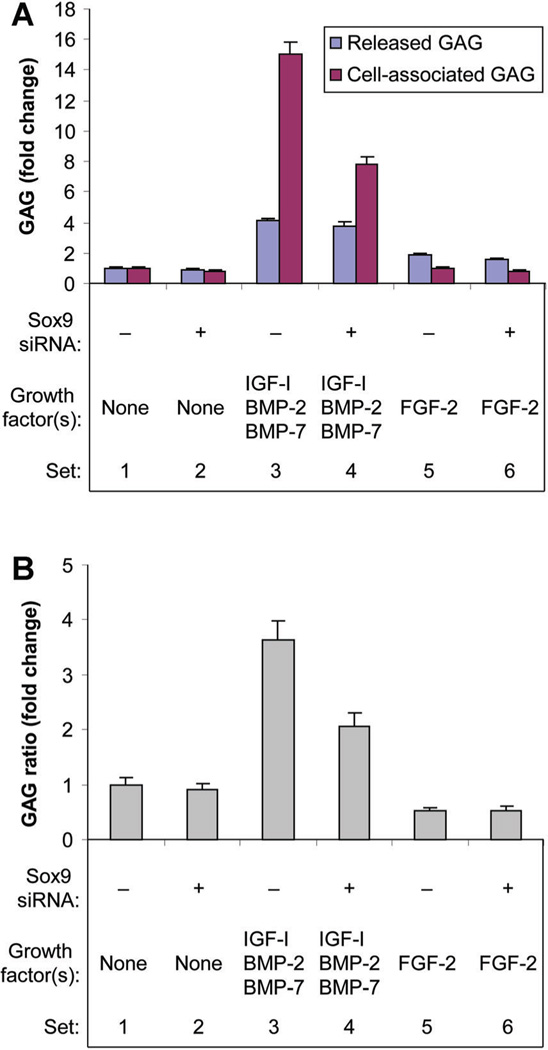
Fig. 6.
Effect of sox9 knockdown on glycosaminoglycan production (A) and glycosaminoglycan distribution between the medium and the cells (B). Chondrocytes were transfected by sox9 siRNA (+) or by non-targeting siRNA (−) and treated with no growth factor (None), FGF-2 or the combination of IGF-I, BMP-2, and BMP-7 proteins. Culture medium was harvested at the designated time points and the cells harvested at 6 days. Glycosaminoglycan in the medium (released GAG) and cell layer (cell-associated GAG) were measured separately. Data are expressed as changes in released GAG and cell-associated GAG (A), and change in the ratio of cell-associated GAG to released GAG (B) for the treatment group compared to the respective control (GAG distribution ratio) ± SD for three independent experiments. Comparison groups are illustrated as data sets. A: Sets 1 versus 2: released GAG (NS), cell-associated GAG 18% (P = 0.0067). Sets 1 versus 3: released GAG 4.14-fold (P < 0.0001), cell associated GAG 15.00-fold (P < 0.0001). Sets 3 versus 4: released GAG (NS), cell associated GAG 48% (P < 0.0001). Sets 1 versus 5: released GAG 1.91-fold (P < 0.0001), cell-associated GAG (NS). Sets 5 versus 6: released GAG 18% (P = 0.0018), cell-associated GAG 17% (P = 0.0091). B: Sets 1 versus 2: NS. Sets 1 versus 3: 3.63-fold (P < 0.0001). Sets 3 versus 4: 43% (P < 0.0001). Sets 1 versus 5: 47% (P < 0.0001). Sets 5 versus 6: NS.

