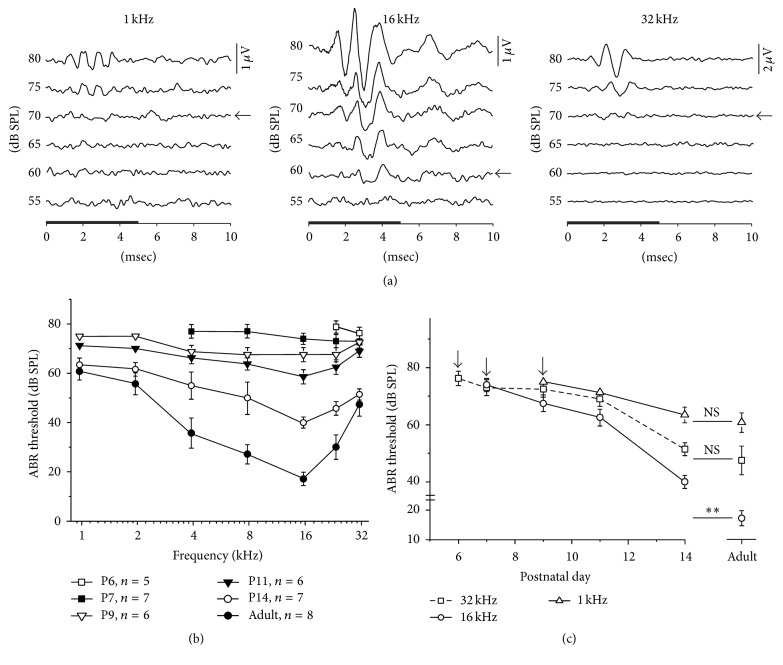
Figure 1.
The ABR threshold changes during postnatal development. (a) The ABR waveforms recorded from a P9 rat pup. Arrows indicate ABR thresholds for 1 kHz, 16 kHz, and 32 kHz tones. The black horizontal bar on the x-axis denotes the 5 ms of the stimulus. (b) The ABR tuning curve changes during development. Data are expressed as the mean ± SD. n indicates the number of animals assessed. (c) The ABR thresholds decreased with time during postnatal development. Arrows indicate the first day on which the ABR appeared for different frequencies. ∗∗ p < 0.01; NS p > 0.05 (Student's t-test).

