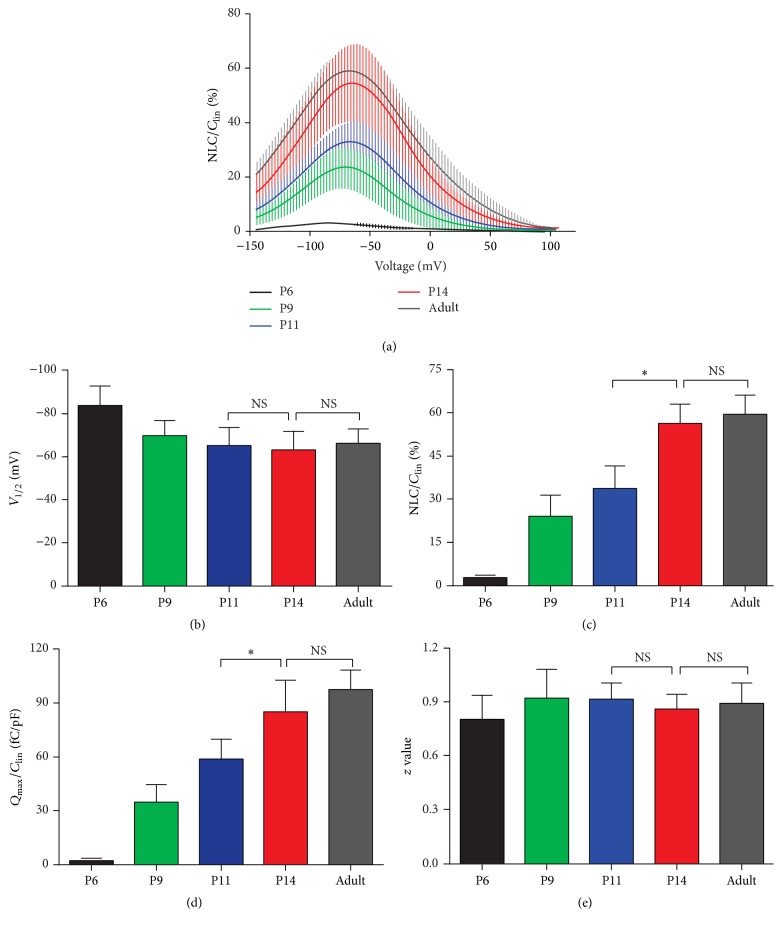
Figure 4.
NLC measured from apical OHCs at various postnatal ages. (a) The mean NLC-voltage responses were fitted with the Boltzmann function (color coded heavy lines). NLC was normalized by C lin and the curves were plotted as the mean ± SD. ((b)–(e)) Four parameters derived from curve fitting with Boltzmann's function. See results for details. Data are expressed as the mean ± SD. n = 4, 8, 8, 12, and 10 for P6, P9, P11, P14, and adult, respectively. ∗ p < 0.05; NS p > 0.05 (Student's t-test).

