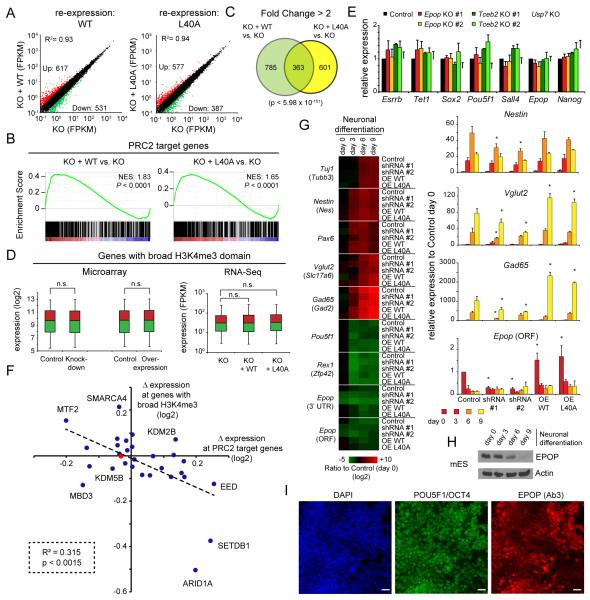
Figure 6. EPOP has low impact on gene expression in mESCs.
A) Comparison of RNA-Seq derived FPKM values of Epop KO and KO cells with re-expressed wildtype (WT) or L40A mutant EPOP. A two-fold cut-off was used for up-(red) and downregulated (green) genes. B) Overlap of affected genes in wildtype or mutant re-expressing cells. The P-value was calculated by a hypergeometric probability test. C) GSEA of PRC2 target genes using RNA-Seq data from wildtype and mutant re-expressing cells compared to KO cells. NES = Normalized Enrichment Score. D) Comparison of gene expression of genes with broad H3K4me3 domain using the RNA-Seq data or published Microarray data (De Cegli et al., 2013). n.s. = not significant. (Student’s t-test) E) RT-qPCR of gene expression of broad H3K4me3 domain possessing pluripotency genes in Epop, Tceb2 or Usp7 KO cells. The values show mean ± SD of duplicates. F) Average gene expression change at PRC2 target genes or genes with broad H3K4me3 domain upon depletion of specific chromatin regulators. Each dot represents an individual cell line depleted for a unique factor. Data are derived from expression profiles of each cell line compared to control cells (Table S4). The red dot marks EPOP. A significant negative correlation of expression changes of PRC2 target genes and genes with broad H3K4me3 domain can be observed. The p-value was calculated via ANOVA. G) Neuronal differentiation of mESC with depleted or over-expressed EPOP. The heatmap shows the expression relative to control cells at day 0, measured by RT-qPCR. The right panels show four examples genes, including the neuronal genes Vglut2 and Gad65. The values show mean ± SD of duplicates (* p < 0.05, Student’s t-test). H) Western blot for endogenous EPOP during neuronal differentiation. Actin is shown as loading control. I) Immunofluorescence of EPOP (using Ab3) and POU5F1/OCT4 in wildtype mESCs. scale bar = 20 μm

