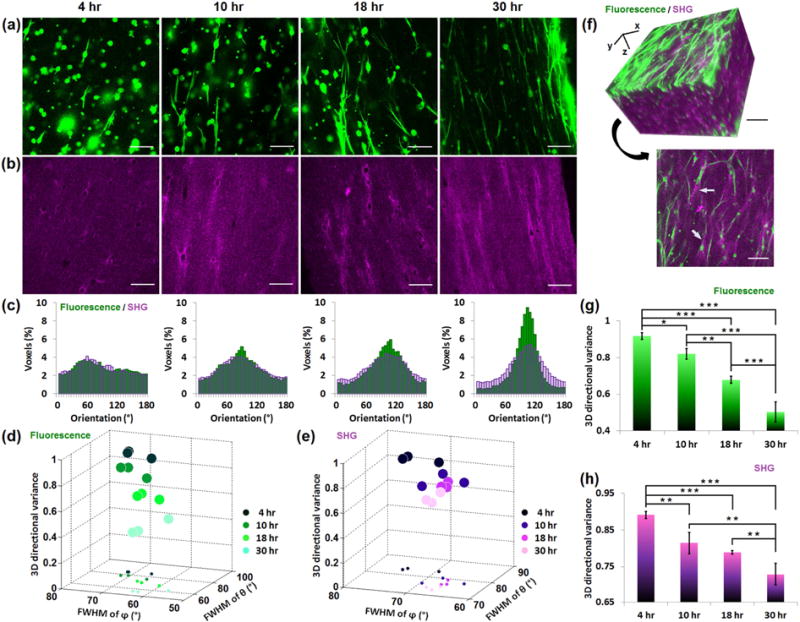
Fig. 3. 3D directional variance assesses the cell alignment and collagen fiber organization in a simple 3D hydrogel.

Primary human fibroblasts are seeded in collagen hydrogels, and dynamic changes during fibroblast-mediated collagen contraction are assessed at 4, 10, 18 and 30 hours post-cell seeding. (a) Representative TPEF images of fibroblasts immunostained with anti-vimentin, DyLight 488 conjugated antibody. (b) SHG images corresponding to the same field as the TPEF images. (c) θ distribution histograms of both the TPEF (green) and SHG (purple) representative images. The plot of 3D directional variance of fibroblasts (d) and collagen fibers (e) as a function of full width at half maximum (FWHM) of the corresponding θ and φ distributions. In each plot, different colors correspond to different time points post-cell seeding. The projections of these 3D scatter points are also plotted on the xy plane. (f) 3D reconstruction of TPEF and SHG signals from 68 images recorded 5 μm apart (top), along with a representative 2D image (bottom). Mean and standard deviation of 3D directional variance calculated separately from the entire 3D image (600.0×600.0×340.0 μm) of fibroblasts (g) or collagen fibers (h). ***, p < 0.001; **, p <0.01; *, p < 0.05. Scale bar, 100 μm.
