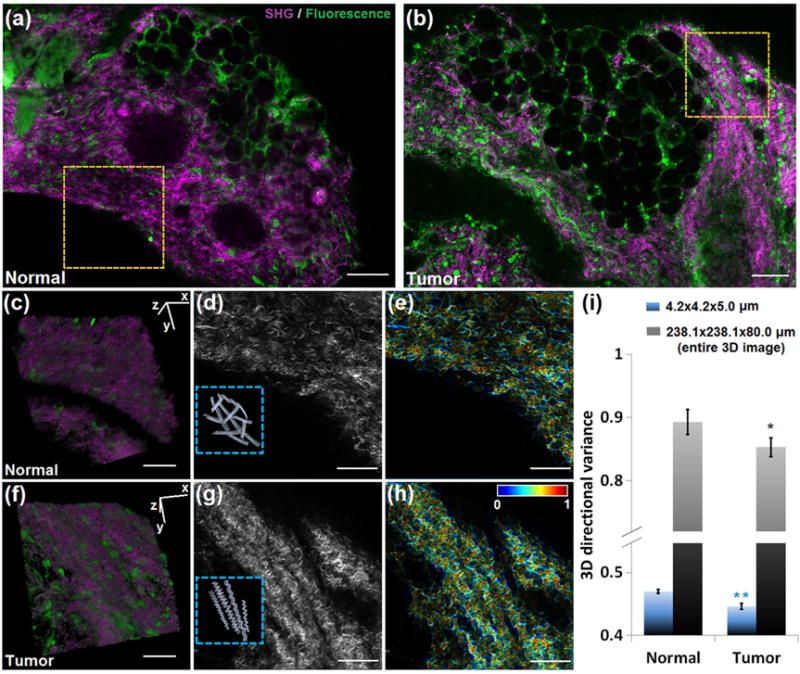
Fig. 5. The 3D directional variance of collagen fibers is higher in normal than in cancer breast tissue.

Representative large-field images of (a) normal mammary gland and (b) mammary tumor, with simultaneous SHG (purple) and TPEF (green) signals. 3D reconstruction of 80 SHG-TPEF images from (c) normal and (f) tumor groups recorded 1 μm apart, corresponding to the regions marked by the dashed yellow box in (a) and (b), respectively. The SHG 2D images of these two areas are shown in (d) and (g), with the schematic illustrations of groups of collagen fibers shown in the insets. The corresponding voxel-wise 3D directional variance maps are shown in (e) and (h), acquired with a localized window of 4.2×4.2×5.0 μm. (i) Mean and standard deviation of 3D directional variance in each group. Besides the localized window, the directional variance is also acquired with a 238.1×238.1×80.0 μm window, which corresponds to the entire 3D image. Significance is tested for each window size. **, p <0.001; *, p < 0.05. Scale bar in (a) and (b), 100 μm. Scale bar in other panels, 50 μm.
