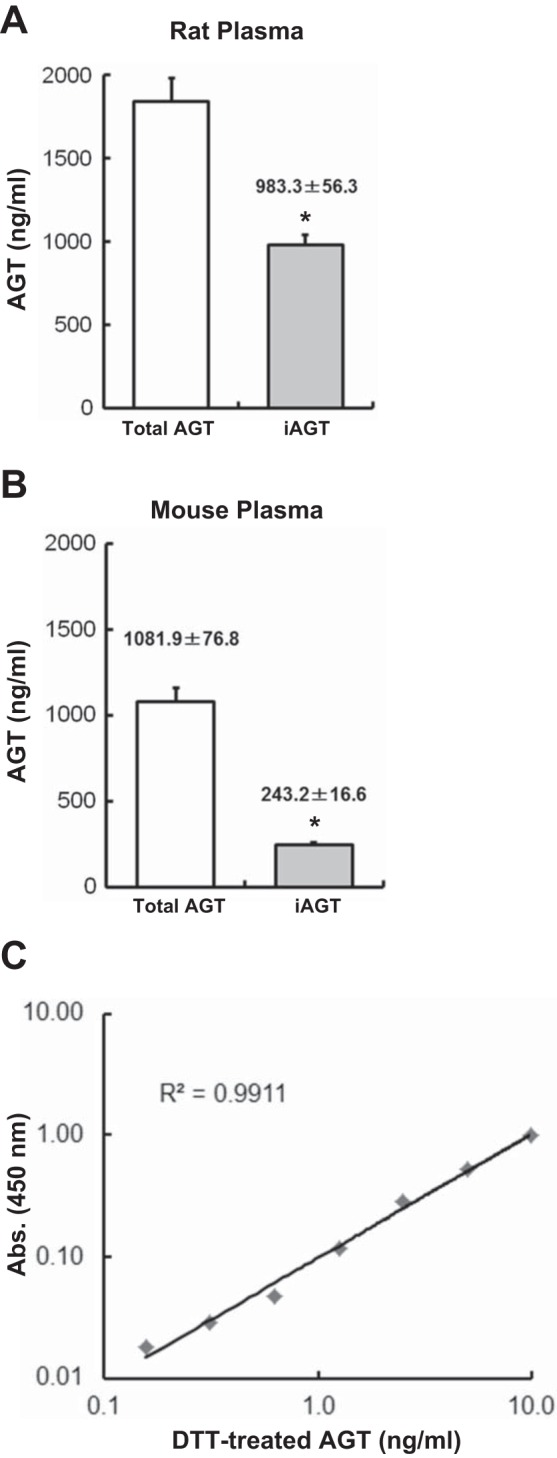
Fig. 3.

tAGT and iAGT levels in rodent plasma. Plasma tAGT and iAGT levels in rats (A, n = 12) and mice (B, n = 12) were measured by using tAGT and iAGT ELISAs. To determine iAGT levels, AGT in the plasma samples was treated by DTT. C: typical standard curve in iAGT ELISA. Data are expressed as means ± SE. *P < 0.05 indicates significant difference compared with each tAGT level.
