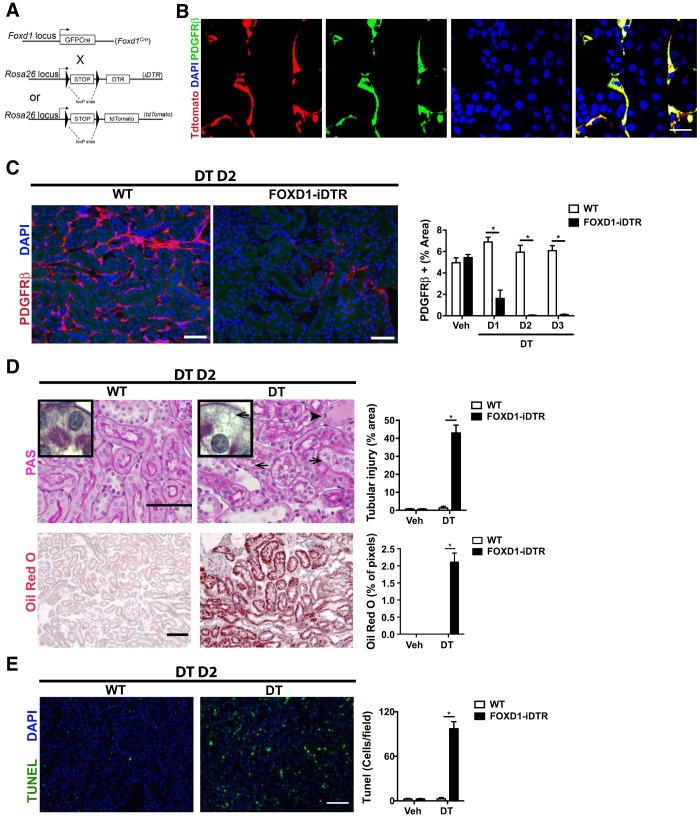
Fig. 1.
Characterization of in vivo ablation of kidney pericytes. A: schema showing simplified gene loci maps for the two alleles that result in FoxD1::iDTR mice expressing the diphtheria toxin (DT) receptor (DTR) in cells of the FoxD1 lineage as well as mice expressing tdTomato in cells of the FoxD1 lineage. B: split panel images showing the expression of tdTomato in adult kidney pericytes derived from FoxD1+ embryonic progenitors identified by coexpression of PDGF receptor (PDGFR)β. DAPI, 4′,6-diamidino-2-phenylindole. Bar = 25 μm. C: detection (left) and quantification (right) of kidney pericytes in FoxD1::iDTR mice that received a single intraperitoneal injection of either vehicle (Veh) or DT. D1–D3, days 1–3 posttreatment; WT, wild type. Values are means ± SD. *P < 0.05 by Student's t-test. Bar = 50 μm. D: determination of tubular injury by periodic acid-Schiff (PAS) staining of kidney sections from vehicle- and DT-recipient FoxD1::iDTR mice (top). Lipid vacuoles are indicated by arrows. The accumulation of proteinaceous fluid in proximal tubules is indicated by an arrowhead. Lipid accumulation was confirmed by oil red O staining (bottom). Values in bar graphs are means ± SD. *P < 0.05 by Student's t-test. Bar = 50 μm. E: TUNEL immunofluorescence showing increased cell death in the kidneys of FoxD1::iDTR mice after DT treatment compared with vehicle. Values are means ± SD; n = 6–7 mice/group. *P < 0.05 by Student's t-test. Bar = 50 μm.

