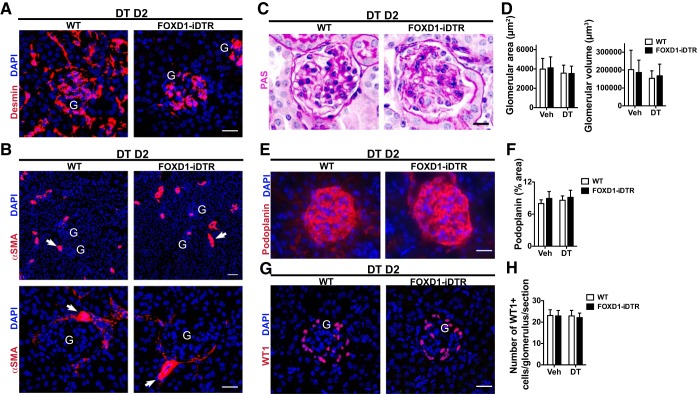
Fig. 2.
Effects of DT administration on the glomerulus. A: detection of mesangial cells using anti-desmin antibody in kidney sections of WT and FOXD1-iDTR mice 2 days after DT administration. Bar = 25 μm. B: detection of vascular smooth muscle (arrows) using anti-smooth muscle actin (SMA) antibody. G, glomerulus. Bar in top image = 50 μm; bar in bottom image = 25 μm. C: images of PAS-stained kidney sections showing glomeruli. Bar = 25 μm. D: quantification of glomerular area and volume. E: detection of podocytes using anti-podoplanin antibody. Bar = 25 μm. F: quantification of podoplanin cells by morphometry. G: detection of podocytes using anti-Wilms' tumor 1 (WT1) antibody. Bar = 25 μm. H: quantification of WT1+ cells. Values are means ± SD; n = 3–5 mice/group.

