Fig. 3.
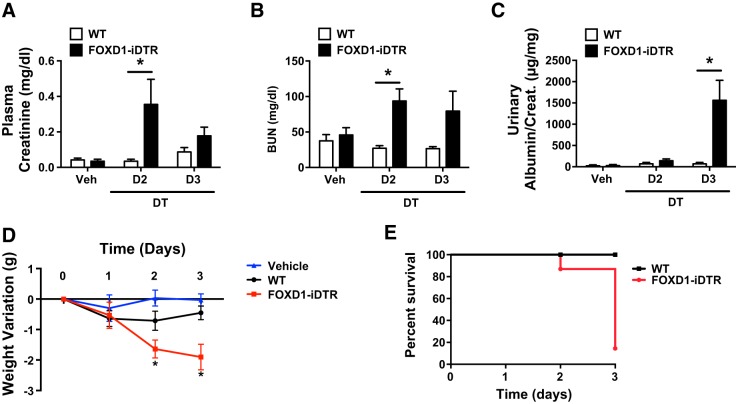
Functional consequences of pericyte ablation. A–C: values corresponding to plasma creatinine (A), blood urea nitrogen (BUN; B), and the urinary albumin-to-creatinine ratio (C). Values are means ± SD. *P < 0.05 by Student's t-test. D: quantification of daily body weight changes in WT and FoxD1::iDTR mice that received daily intraperitoneal injections of either vehicle or DT. E: survival curves for WT and FoxD1::iDTR mice treated with DT. n = 6–8 mice/group.

