Fig. 5.
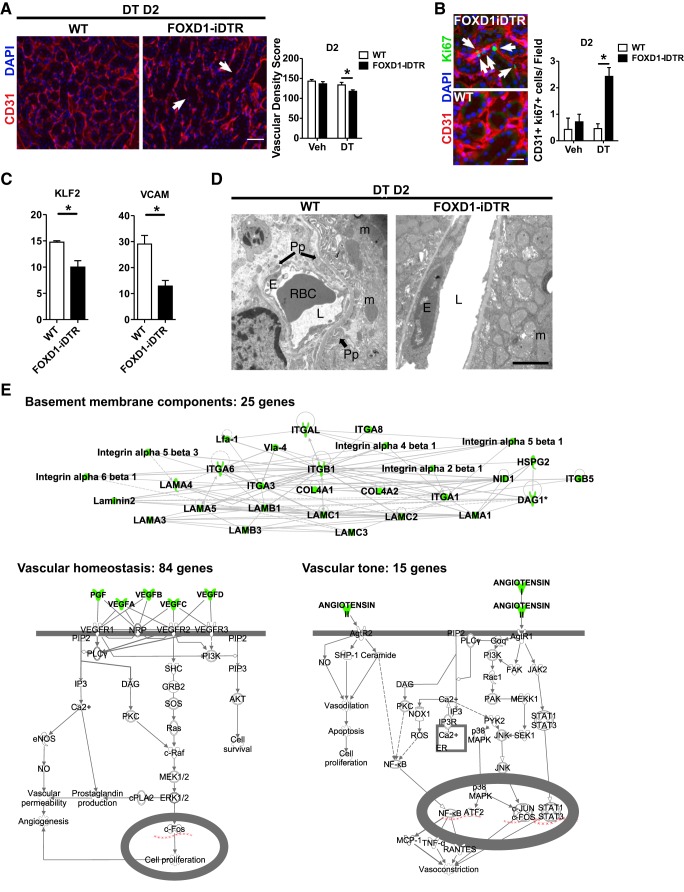
Role of pericytes in regulating capillary homeostasis. A, left: representative CD31 immunofluorescence images from FoxD1::iDTR mice at day 2 of either vehicle or DT treatment. Arrows indicate areas of capillary loss. Bar = 50 μm. Right, quantification of capillary density. B: representative CD31 and Ki67 immunofluorescence images (bar = 25 μm) and quantification of endothelial cell proliferation. Arrows indicate proliferating endothelial cells. C: quantitative PCR quantification of Krüppel-like factor (KLF)-2 and VCAM mRNA. Values are means ± SD. *P < 0.05 by Student's t-test. D: electron microscopy images of either vehicle- or DT-treated FoxD1::iDTR mouse kidneys. Pp, pericyte; L, lumen; E, endothelial cell; RBC, red blood cell; m, mitochondria. Bar = 2 μm. E: analysis of pericyte-specific translational profiles from healthy Col1a1::GFP-L10a mouse kidneys by translated ribosomal affinity purification (TRAP). Col, collagen; GFP, green fluorescent protein. Pathway enrichment analysis was performed using pathway analysis software.

