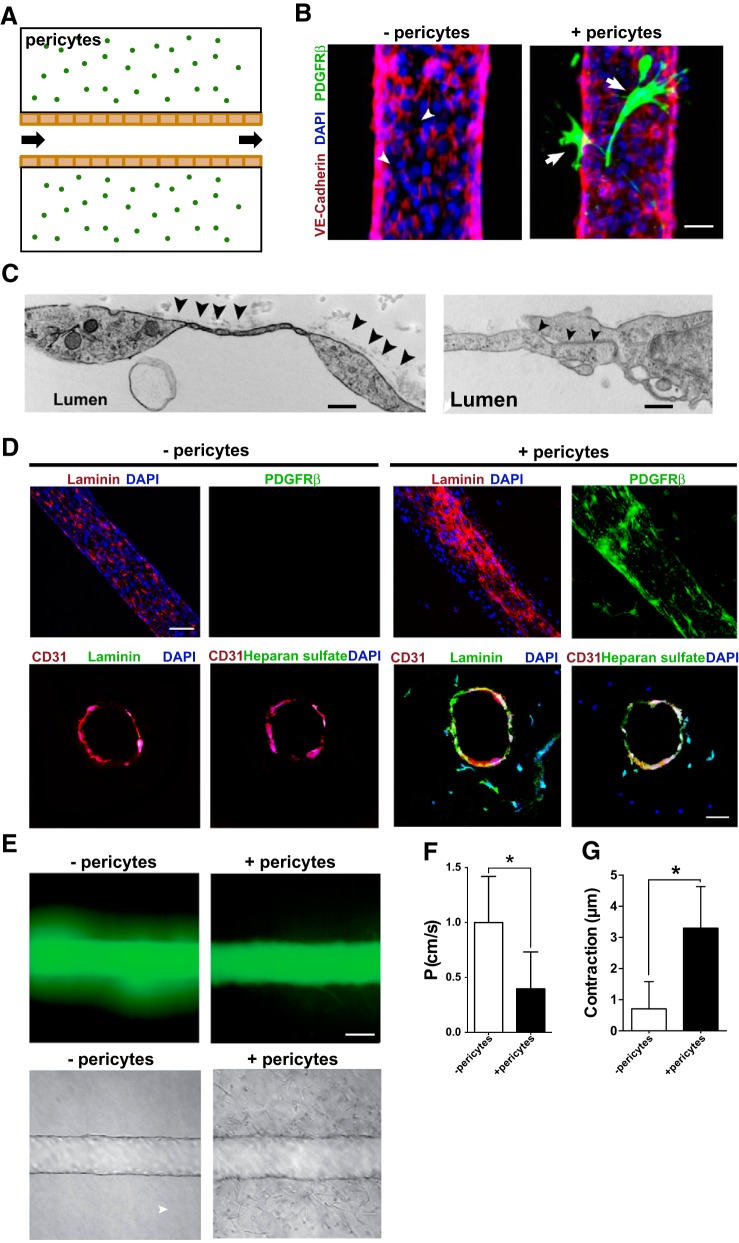
Fig. 6.
Evaluation of human kidney pericyte function in microphysiological devices. A: schema showing the microfluidic device used. The flow was automated, constant, and unidirectional through a 150-μm lumen. B: representative immunofluorescence images showing capillaries formed by purified human kidney microvascular endothelial (HKMECs) labeled with vascular-endothelial cadherin (red) with (+) or without (−) pericytes (green). Bar = 25 μm. C: electron microscopy scanning of microfabricated human capillaries showing basement membrane matrix deposition on the abluminal face (left; bar = 1 μm) and tight junctions (right; bar = 500 nm). D: immunofluorescence images of fabricated kidney capillaries immunostained with antibodies against laminin and heparan sulfate in the absence or presence of pericytes (PDGFRβ). Top, longitudinal scanning; bottom, cross-sectional scanning. Bar = 50 μm. E, top: fluorescence imaging of dextran diffusion. Bottom, bright-field images of microfluidic channels coated with HKMECs in the absence or presence of pericytes. Bar = 50 μm. F: quantification of vessel permeability (P). Values in the bar graph are means ± SD. *P < 0.05 by Student's t-test. G: quantification of microfluidic vessel contraction. Values in the bar graph are means ± SD. *P < 0.05 by Student's t-test.

