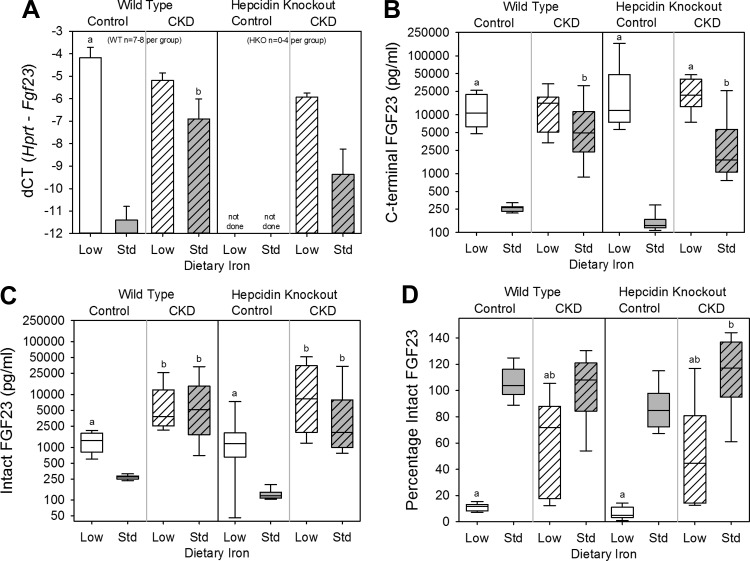
Fig. 4.
FGF23 parameters in wild-type and hepcidin knockout mice. Included are bone Fgf23 mRNA expression (A), plasma C-terminal FGF23 (B), plasma intact FGF23 (C), and percentage of intact FGF23 (D) for all groups. a: Statistically significant pairwise comparison of low- vs. standard-iron groups within the wild-type control, wild-type CKD, hepcidin knockout control, and/or hepcidin knockout CKD cohorts; b: statistically significant pairwise comparison of control vs. CKD groups within the wild-type low-iron, wild-type standard-iron, hepcidin knockout low-iron, and/or hepcidin knockout standard-iron cohorts. Given multiple comparison testing, the Benjamini-Hochberg correction was used. Data in A are presented as means and SE. Data in B, C, and D are presented as medians and interquartile ranges, with box plot whiskers representing the 10th and 90th percentiles; n = 8–14 mice/group, except where denoted on the graphs. In A, bone Fgf23 mRNA expression was not able to be performed in the hepcidin knockout control mice secondary to sample degradation.

