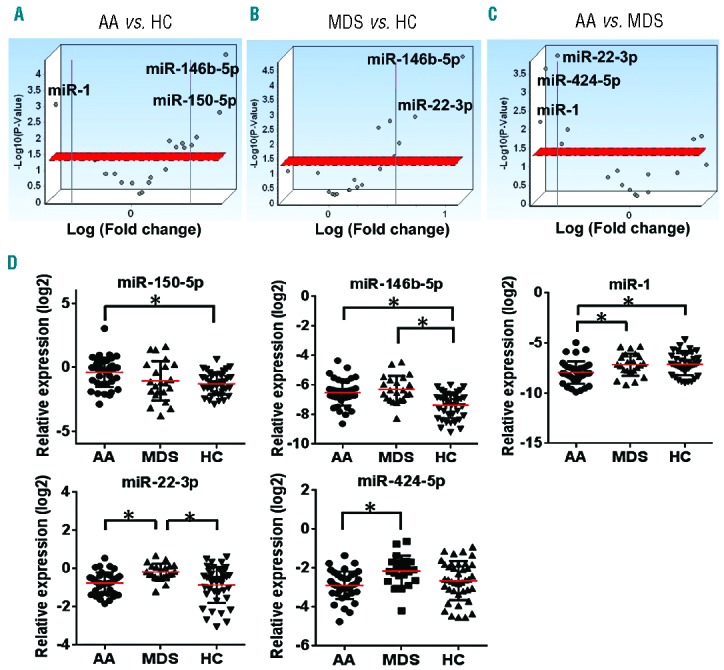
Figure 2.

Validation of the circulating microRNA (miRNA) expression profiles in the validation set. (A-B) Volcano plots of 19 miRNA expression levels in the plasma of AA (n=41), MDS (n=24), and HC (n=43) in the validation set. The x-axis is the estimated difference in expression measured in log2; vertical lines refer to a 1.5-fold difference in expression between the two groups. MiRNAs highly expressed in AA (MDS) or HC are on the right or the left, respectively. The y-axis is the significance of the difference measured in −log10 of the P-value; the horizontal red line represents our cut-off for significance at P<0.05. (C) Volcano plots of 19 miRNA expression levels in the plasma of AA (n=41) and MDS patients (n=24) in the validation set. MiRNAs highly expressed in AA or MDS are on the right or the left, respectively. (D) miR-150-5p, miR-146b-5p, miR-1, miR-22-3p, and miR-424-5p expression in the plasma of AA (n=41), MDS (n=24), and HC (n=43). *P<0.05 (one-way ANOVA). AA: aplastic anemia; HC: healthy control; MDS: myelodysplastic syndrome.
